Covid Vaccine Adverse Events

Covid Vaccine Adverse Events

Post-vaccination deaths reported to the US VAERS system, 1990 to November 2021 (OpenVAERS)

Updated: January 2022
Published
: June 2021
Share on: TG / TW / FB
Select LanguageDutchEnglishFrenchGermanGreekHebrewHungarianItalianJapaneseKoreanPolishPortugueseRussianSpanishSwedishTurkishPowered by

An overview of severe covid vaccine adverse events.

Please note: SPR covers only vaccine-related issues that are of global importance. To study case reports of vaccine-related injuries and deaths, see Covid Vaccine Injuries (18+).

A) Neurological disorders

Covid vaccinations have been associated with several neuro-inflammatory and neuro-degenerative disorders, including Guillain-Barré syndrome (GBS), multiple sclerosis (MS, new-onset or relapse), transverse myelitis (TM), and acute disseminated encephalomyelitis (ADEM).

Neurological auto-immune reactions may be due to antigenic cross-reactivity and typically occur within days or weeks of vaccination. Symptoms vary and may include muscle weakness and paralysis, tremors and seizures, as well as cognitive issues (see video below).

By November 2021, about 2000 cases of post-vaccination GBS had been reported to the US VAERS systems and about 500 cases had been reported to the British MHRA system. Back in 1976, the US swine flu vaccination campaign was stopped due to an increased risk of GBS.

See also: Studies and case reports (TG)

Video: Various post-vaccination neurological disorders (18+)https://videopress.com/embed/DqM4nXEo?hd=1&cover=1&loop=0&autoPlay=0&permalink=1

Image: Post-vaccination MS brain lesions in a previously healthy 26-year-old woman.

Post-vaccination MS brain lesions in a 26-year-old woman (more)

B) Menstrual disorders, miscarriages, birth defects

US authorities have argued that covid vaccines “appear to be completely safe for pregnant women” (NIH) and “are thought not to be a risk to lactating people or their breastfeeding babies” (CDC). However, the US VAERS system counts already more than 3,000 post-vaccination miscarriages, and it has been known since March 2021 that covid vaccines, or the spike protein they produce, may get into breast milk and sicken or kill a baby (e.g. by causing internal bleeding or allergic reactions).

In addition, by September 2021, more than 30,000 British women had reported post-vaccination menstrual disorders, such as excessive bleeding, and several cases of post-vaccination birth defects, including cardiac anomalies or pulmonary hemorrhage, have been reported.

In Scotland, an investigation has been launched into a spike in deaths among newborn babies. Of note, the Pfizer vaccine trial in pregnant women continues to be delayed for “lack of participants”. Regarding female fertility, it is too early to know if covid vaccines might have any impact.

Update: An age- and trimester-adjusted analysis of British stillbirth data found that covid vaccination (mostly in the third trimester) increased the risk of stillbirth by about 33%.
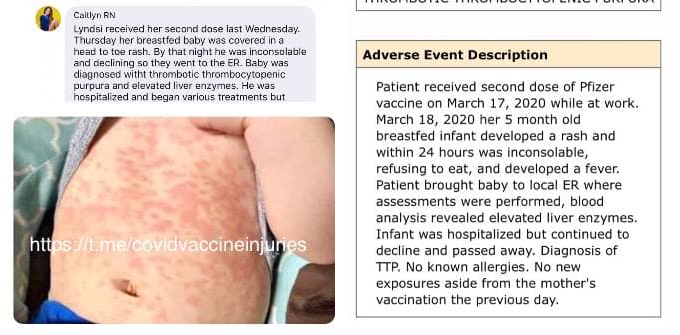
A breastfeeding baby with fatal internal bleeding (source)

C) Heart inflammation, heart attacks, cardiac arrest

In March 2021, Israel first reported a “murky wave of heart attacks” and an increase in post-vaccination all-cause mortality. In June, the Israeli Ministry of Health confirmed that covid mRNA vaccines may cause heart inflammation (myocarditis) and heart attacks, especially in young people. In September, a US study showed that in healthy male adolescents, the risk of post-vaccination myocarditis is about five times higher than the risk of covid hospitalization.

In young males, the risk of post-vaccination myocarditis may reach about 1 in 1000 (including subclinical cases). In October, several Nordic countries partially or fully halted the use of the high-dosed Moderna mRNA vaccine due to the elevated risk of myocarditis. In November, Taiwan suspended the second dose of the Pfizer vaccine in adolescents.

Post-vaccination myocarditis may also affect athletes and may lead to sudden cardiac arrest. Since the beginning of the covid vaccination campaign, several hundred professional athletes collapsed or died from cardiac arrest or heart attacks. In several countries, cases of myocarditis have significantly increased during covid vaccination campaigns. Myocarditis, even if “mild” (i.e. self-limiting), may cause long-term heart issues.

A study in mice found that if mRNA vaccine gets into a vein, the heart muscle absorbs the mRNA, starts producing coronavirus spike protein, gets attacked by the immune system, and develops inflammation and cell damage (i.e. myocarditis). This is likely what happens in humans, too, if the vaccine accidentally gets injected into a blood vessel instead of muscle cells.

See also: Athlete cardiac arrests (overview) and Cardiac Arrest in Athletes (TG)

Image: Heart issues in European soccer players (December 2021)

Three professional soccer players suffering heart issues within one week (more)

Vaccine-induced myocarditis has also affected children and adolescents.

Vaccine-induced heart muscle inflammation in adolescents (more)

Myocarditis after covid vaccines (red) vs. flu vaccines (blue, all years) by age:

Myocarditis after covid vaccines (red) vs. influenza vaccines (blue) by age (OpenVaers)

D) Blood clots and strokes

Blood clots, stroke and pulmonary embolism continue to be major covid vaccine adverse events, especially after adenovector covid vaccines (AstraZeneca, Johnson&Johnson). In response, several countries have suspended the use of adenovector covid vaccines altogether or in non-senior citizens, in whom the risk is most pronounced.

In April 2021, AstraZeneca acknowledged that up to 10% of people receiving their covid vaccine may develop transient thrombocytopenia (low blood platelet count), which, in severe cases, may turn into thrombotic thrombocytopenia and increased risk of blood clots.

Life-threatening blood clots have also affected professional athletes and have caused pulmonary embolism (blood clots in the lung) and cerebral bleeding. A 44-year-old BBC moderator died due cerebral bleeding caused by the AstraZeneca vaccine. Several cases of leg amputations due to vaccine-induced blood clots have also been reported (see image below).

Of note, the risk of blood clots may increase during air travel. British Airways confirmed the death of three of their pilots, aged 30 to 55, without disclosing their cause of death or vaccination status. A German Lufthansa First Officer collapsed during a flight from Spain to Germany.

There are also ‘anecdotal’ reports of unusual cardiovascular complications several months after vaccination, raising the question of potential long-term cardiovascular damage: for instance, six months after vaccination, a healthy 13-year-old boy had a fatal cardiac arrest, a healthy 15-year-old girl had a fatal brain aneurysm, and a healthy ~35-year-old woman had a life-threatening stroke.

Leg amputations due to vaccine-induced blood clots (more)

The following figure shows a brain MRI of a vaccine-induced cerebral sinus venous thrombosis and cerebral hemorrhage (brain bleed) in a 32-year-old woman (more):

Brain MRI of a vaccine-induced cerebral sinus venous thrombosis in a 32-year-old woman (more)

E) Severe skin reactions

Skin reactions have been reported quite frequently after covid vaccinations. They include various types of rashes and eczema, chronic hives, but also immune responses affecting blood vessels in the skin (eryhtema multiforme or thrombotic thrombocytopenic purpura).

Read more: COVID-19 Vaccines and the Skin (Dermatlogic Clinics)
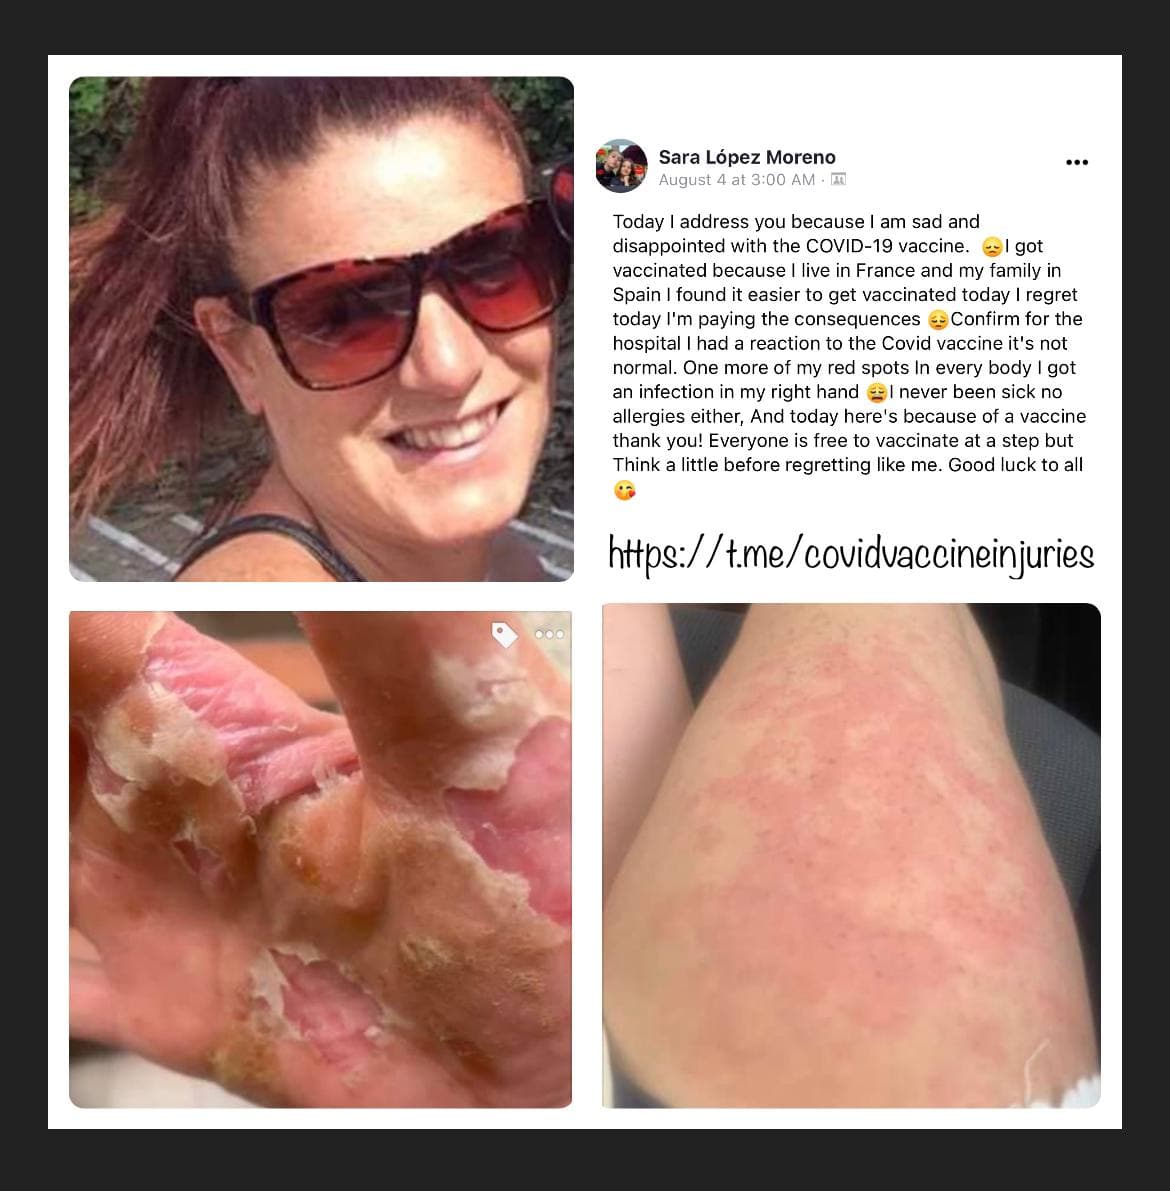
A severe, vaccine-related skin reaction (more)

F) Eye disorders and blindness

Covid vaccines may lead to bleeding and inflammation in the eyes and, in severe cases, to retinal detachment and blindness. In the UK, several hundred cases of post-vaccination blindness have been reported. In the US, about 2,500 reports to the VAERS system mention post-vaccination blindness. There are also reports of post-vaccination eye disorders affecting the eye lens (e.g. cataract), but the causality is currently less clear in these cases.

Vaccine-induced bleeding in the eye (more)

G) Bell’s palsy (facial paralysis)

Bell’s palsy is a unilateral facial paralysis that may last for up to six months. By December 2021, about 12,000 cases of post-vaccination Bell’s palsy had been reported to the US VAERS system, but the real number of cases is likely in the tens of thousands.

Video: A woman affected by post-vaccination Bell’s palsy (more):https://videopress.com/embed/oGEDp5UI?hd=1&cover=1&loop=0&autoPlay=0&permalink=1

H) Shingles and other virus reactivations

Reports of post-vaccination shingles (i.e. varicella zoster virus reactivation) have been quite frequent: by December 2021, about 11,000 cases of post-vaccination shingles had been reported to the US VAERS system (the true figure may be close to 100,000).

Varicella zoster virus reactivation may occur due to temporary vaccine-induced immune suppression (lymphocytopenia); about 20% of shingles patients develop a type of long-lasting neurological pain called postherpetic neuralgia (PHN).

The vaccine-induced reactivation of other latent virus infections, including human papilloma virus (HPV) and Epstein-Barr virus (EBV), has also been reported.

See also: Shots and shingles: What do they tell us? (Doctors for Covid Ethics)
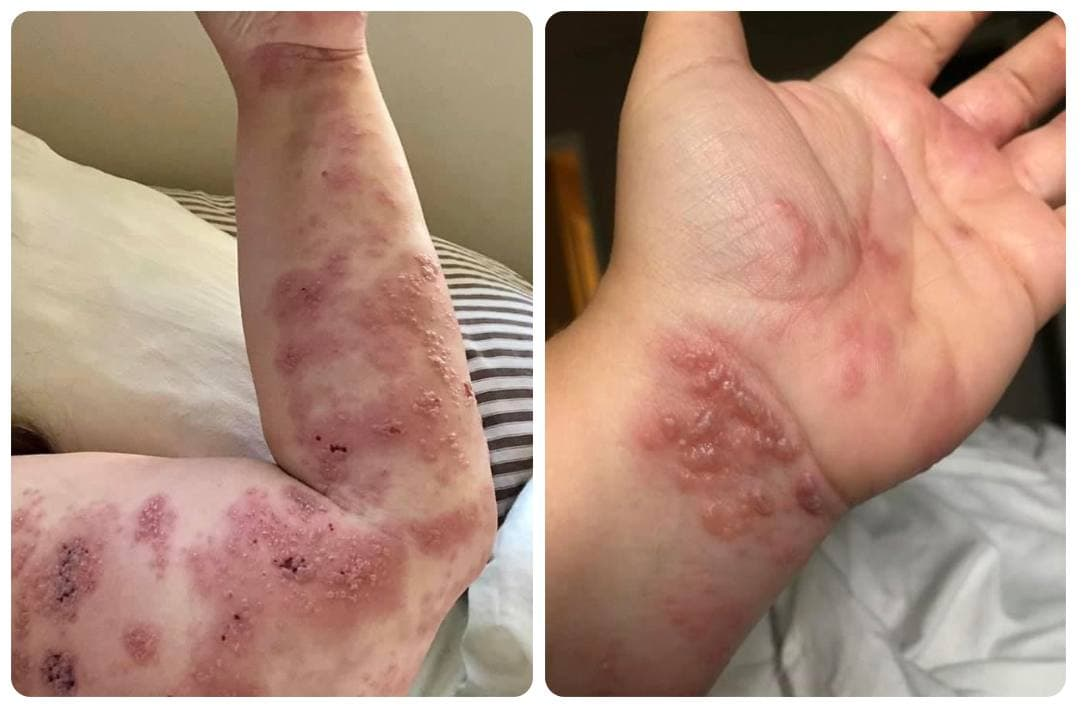
Post-vaccination shingles within 48 hours (more)

J) Tinnitus, hearing loss, dizziness and vertigo

New onset of tinnitus is a rather frequently reported adverse event of covid vaccines: by December 2021, about 16,000 cases of post-vaccination tinnitus had been reported to the US VAERS system. In addition, several thousand cases of deafness or sudden hearing loss have been reported.

Of note, the Johnson & Johnson covid vaccine clinical trial had already included six cases of post-vaccination tinnitus, but the US FDA later ruled that they were ‘unrelated to the shot’. Vaccine-induced tinnitus may be caused by neuro-inflammation or blood vessel disorders, such as endothelial dysfunction.

In addition to tinnitus, there are also numerous reports of post-vaccination dizziness and vertigo, which may be due to immune reactions affecting the vestibular system in the inner ear.

Video: ABC report on post-vaccination tinnitus (ABC News)

A case of tinnitus caused by a covid mRNA vaccine (more)

K) Anaphylactic shock

Covid vaccinations can cause a potentially life-threatening anaphylactic (allergic) shock. People affected by an anaphylactic shock typically collapse shortly after vaccination. By December 2021, about 8,500 cases of anaphylaxis had been reported to the US VAERS system. According to studies, anaphylaxis is more frequent after covid vaccines compared to other vaccines.

Video: An anaphylactic shock immediately after covid vaccination (more):https://videopress.com/embed/WcAEasmC?hd=1&cover=1&loop=0&autoPlay=0&permalink=1

L) Tumor growth and cancer

While there is no evidence that covid vaccines themselves are carcinogenic (i.e. cancer-causing), it has been shown that covid vaccines can cause a temporary immune suppression (lymphocytopenia) in up to 50% of people, which in turn might, in some cases, influence tumor growth (similar to the reactivation of varicella zoster virus, described above).

In official adverse event reporting systems and in vaccine-related online patient groups, there are already several thousand case reports of sudden post-vaccination tumor growth and cancer, even in young people, although some of these cases may certainly be coincidental.

Read more: Covid vaccines and cancer (SPR)

Image: Rapid progression of T-cell lymphoma following a Pfizer booster shot.

Rapid progression of T-cell lymphoma following Pfizer booster shot (Goldman et al)

Video: US clinical pathologist Dr. Ryan Cole describes a significant post-vaccination increase in certain types of cancer. German pathologists also noted the issue of post-vaccination immune dysregulation and sudden tumor growth in some patients.https://videopress.com/embed/HJY0tMWs?hd=1&cover=1&loop=0&autoPlay=0&permalink=1

Dr Ryan Cole on post-vaccination cancer (full video)

M) Appendicitis

By December 2021, post-vaccination appendicitis had been mentioned in about 1,000 reports to the US VAERS system. According to the US CDC, “the most common serious adverse events in the vaccine [trial] group which were numerically higher than in the placebo group were appendicitis, acute myocardial infarction, and cerebrovascular accident.” Appendicitis might occur due to vaccine-induced immune suppression or due to vaccine-induced mesenteric venous micro-thrombosis.

N) Children: PIMS, myocarditis, blood clots

Covid vaccination was thought to prevent pediatric inflammatory multi-system syndrome (PIMS), a rare condition associated with covid in children. Instead, it turned out that covid vaccines may themselves trigger PIMS, which is most likely caused by an immune reaction to the spike protein. Vaccine-induced PIMS was first noticed in Israel and was later confirmed by EMA.

By December 2021, the US VAERS system had received several hundred reports of post-vaccination heart inflammation and even strokes in children 5 to 17 years old. Some of these children had already recovered from mild or even asymptomatic covid prior to their vaccination.

In a letter to the British Medical Journal, a group of doctors wrote: “For young age groups, in whom covid-related morbidity and mortality is low, and for those who have had covid-19 infection already, and appear to have longstanding immunological memory, the harms of taking a vaccine are almost certain to outweigh the benefits to the individual, and the goal of reducing transmission to other people at higher risk has not been demonstrated securely.”

Read more: Post-vaccination adverse events in children

Post-vaccination deaths and injuries in children (HIN)

O) Diabetes and diabetic ketoacidosis

In October 2021, a Chinese study published in Nature Cell Discovery first reported a “consistent increase” in post-vaccination blood sugar levels (HbA1c) lasting several months. Blood sugar levels peaked about one month after vaccination and reached prediabetic levels in about 30% of previously healthy participants. In addition, the study also found consistent alterations in serum sodium and potassium levels, coagulation profiles, and renal functions.

In September 2021, a US study reported several cases of post-vaccination hyperglycemic emergencies, including hyperglycemic syndrome and diabetic ketoacidosis. The first widely reported case of a post-vaccination death due to diabetic ketoacidosis was 42-year-old cyber security expert Dan Kaminsky in April 2021.

Vaccine-induced hyperglycemic emergencies (Lee et al., JES, September 2021)

P) Other autoimmune diseases

In addition to neurological autoimmune diseases described above, covid vaccine have already been linked to several other new-onset autoimmune diseases, including, in particular, autoimmune hepatitis (i.e. chronic liver inflammation; more cases).

See also: Studies and case reports (Telegram)

Covid vaccines and autoimmune hepatitis (Erard et al)

Q) Booster toxicity

Several covid vaccine vaccine adverse events, including cardiovascular adverse events, have been shown to be dose-dependent. Thus, they are more likely to occur after the high-dosed Moderna vaccine compared to the lower-dosed Pfizer vaccine (100μg vs. 30μg mRNA), and they are more likely to occur after the second or third dose compared to the first dose.

In December 2021, the Canadian province of Quebec decided to stop booster vaccinations of senior citizens who had previously been infected after an increase in life-threatening booster vaccine reactions had been observed (previously also reported in Germany and in Israel). It is also known that mRNA lipid nano-particles themselves can cause toxicity if injected repeatedly over several months or years.

Read more: Booster adverse events (VAERS compilation)

Safety signals during vaccine trials

Several serious adverse events were already observed during official covid vaccine trials, but were discarded as “unrelated”. An editor of the British Medical Journal noted that the Pfizer vaccine trial had excluded, without explanation, five times more people from the vaccine group than from the control group. In the Pfizer vaccine trial for adolescents, as 12-year-old girl suffered permanent paralysis, but Pfizer reported her case merely as “abdominal pain”.

Causality and Under-Reporting

Some post-vaccination injuries may be unrelated to the vaccination. However, in the US, about 50% of post-vaccination deaths occurred in people who became ill within 48 hours of being vaccinated. Furthermore, a systematic analysis found that even in senior citizens, about 85% of post-vaccination deaths reported to VAERS were plausibly caused by the covid vaccine.

A large 2006 meta-study found that reporting systems of drug adverse events typically cover only about 5% to 20% of all adverse events experienced by drug recipients (under-reporting). Thus, reported adverse events may have to be multiplied by a factor of 5 to 20 to get actual adverse events.

In an open letter published in October 2021, Dr. Hartmut Glossmann – professor of Pharmacology, one of Austria’s most cited scientists in the world, founder of the first Austrian Drug Commission and long-time editor of a German pharmaceutical publication – described covid vaccines as “the biggest drug scandal” he has ever witnessed.

Case reports

To study case reports of vaccine-related deaths and injuries, see:

To study cases of vaccine skeptics dying of covid, see “Sorry Antivaxxer”.

Video: Cardiac arrests in athletes

There have been a record number of professional and amateur athletes suffering a cardiac arrest or heart attack in 2021, typically within weeks of vaccination (5-minute compilation).

See also: Athlete cardiac arrests (overview) and Cardiac Arrest in Athletes (TG)https://videopress.com/embed/rHQvj8Vi?hd=1&cover=1&loop=0&autoPlay=0&permalink=1

Video: How covid vaccines got approved

“Hearing without listening”: At FDA hearing on coronavirus vaccine, the chair cut off questions and limited debate. (One minute video, The Defender)https://videopress.com/embed/iFHuVD1u?hd=1&cover=1&loop=0&autoPlay=0&permalink=1

Video: The Testimonies Project

An Israeli documentary on covid vaccine injuries (1 hour; source: The Testimonies Project).https://rumble.com/embed/vk35c3/?pub=rqlj3

.

Coronavirus Covid-19 Research History – Index

.
Specific Issues Index

from Creating Better World

Posted in coronavirus, Covid-19, pandemic | Tagged , , , , , , | Leave a comment

Covid versus the flu, revisited

Covid versus the flu, revisited

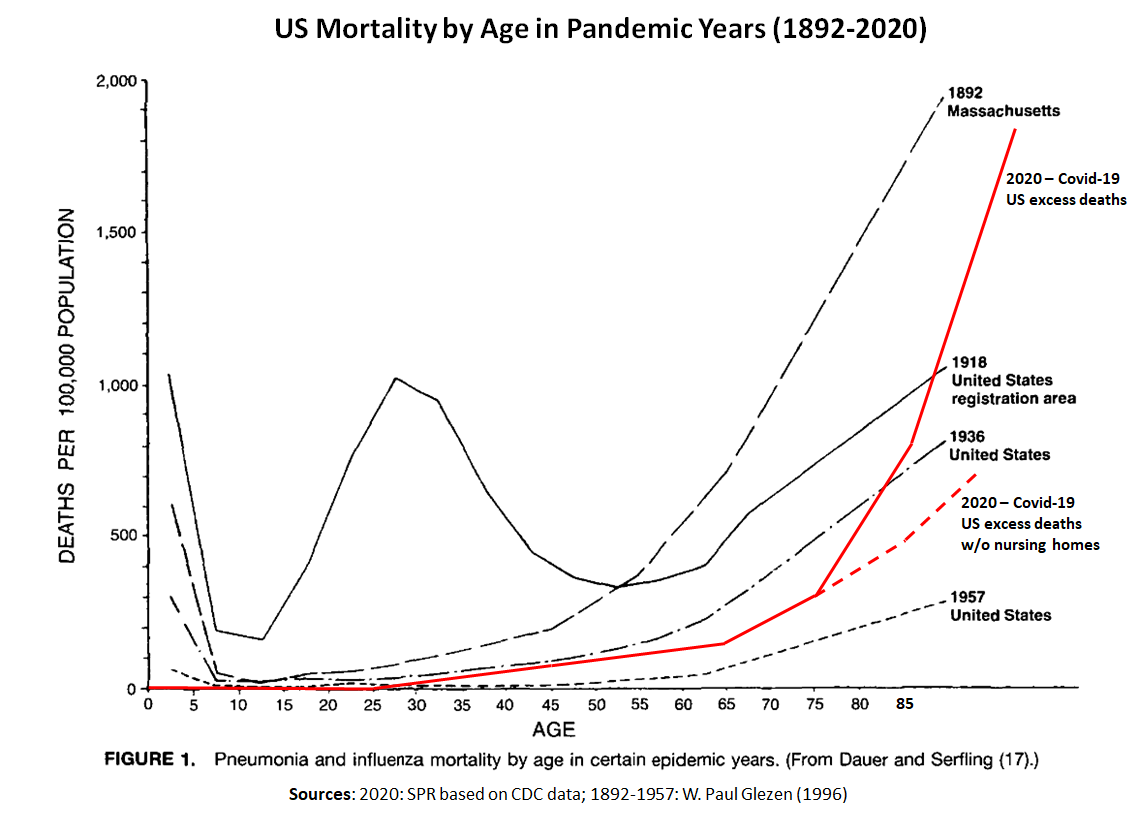
Pneumonia and influenza mortality by age in previous pandemic years (Glezen, 1996) vs. 2020 excess mortality by age, primarily driven by covid-19, overall and excluding nursing homes (SPR based on CDC data)

Published: March 21, 2021
Share on: Twitter / Facebook
Select LanguageDutchEnglishFrenchGermanGreekHebrewHungarianItalianJapaneseKoreanPolishPortugueseRussianSpanishSwedishTurkishPowered by

The legitimacy of comparing covid-19 and “the flu” has been a heatedly debated topic during the current pandemic. To clarify the situation, the above chart shows US influenza and pneumonia mortality by age in previous pandemic years compared to 2020 US excess mortality, which consisted primarily (>75%) of confirmed and suspected covid-19 deaths, according to the CDC.

As can be seen, up to about 75 years of age, 2020 mortality ranged between the 1957 “Asian flu” and the 1936 flu. Above 75 years, and especially above 85 years, 2020 mortality increased steeply and surpassed even the 1918 flu. This very steep increase was primarily driven by deaths in nursing homes (solid vs. dashed red lines), which accounted for about 40% of all US covid-19 deaths. The combination of a very high mortality in the elderly, and a high proportion of the elderly in modern Western societies, led to a very high overall mortality impact of covid-19.

Clearly, 2020 did not encompass all US covid-19 deaths (the peak of the second wave was reached in mid-January 2021), but earlier pandemics also extended over two to three years. Furthermore, in 2020 there were “lockdowns” in many US states; however, during earlier pandemics, measures such as face masks and school closures had also been employed. Moreover, a comparison of covid-19 mortality in California and Florida, for instance, indicates that most anti-pandemic measures in 2020 were of very limited utility. Finally, against both the 1957 and the 1968 pandemic influenza viruses, an effective vaccine was available within months.

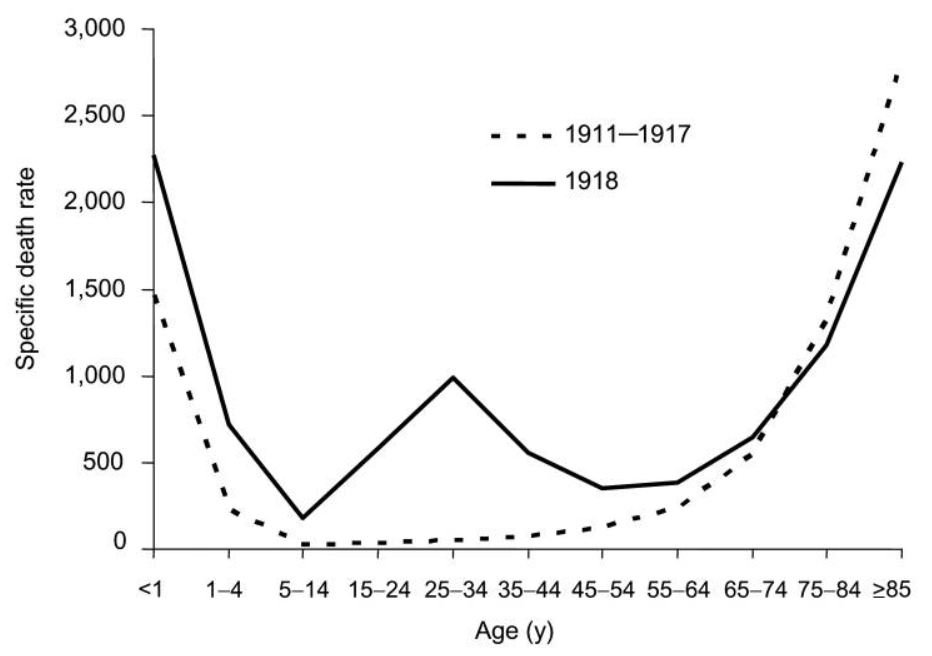
Another noteworthy aspect is that the 1918 influenza actually had a very limited mortality impact on people over the age of about 45 years (see figure below); it is generally thought that these people benefited from some degree of immunity due to exposure to a similar influenza virus that had been circulating in the 19th century, prior to the 1890 pandemic. In fact, 99% of excess influenza deaths in 1918 were in people younger than 65 years. Similarly, the 1957 influenza pandemic had a limited impact on people over 70 due to some degree of prior immunity, acquired in the 19th century.

In contrast, no such prior immunity existed against the novel SARS coronavirus. As a result, the age profile of the covid-19 mortality resembles most closely the 1889-1892 pandemic (see figure above), which some researchers believe was also caused by a then novel coronavirus (OC43).

Finally, another major difference between covid-19 and previous influenza pandemics is that influenza pandemics had a major impact on the mortality of young children, whereas covid-19 overall is very mild to young children (see figure above). This difference might be due to the fact that the novel coronavirus uses cell receptors that are driven by (male) sexual hormones.

See also: Covid-19 Mortality: A Global Overview and Why covid is a “strange pandemic”

1918 influenza mortality by age compared to baseline (Taubenberger & Morens, 2006)

Addendum

1) Coronavirus infection level per US state

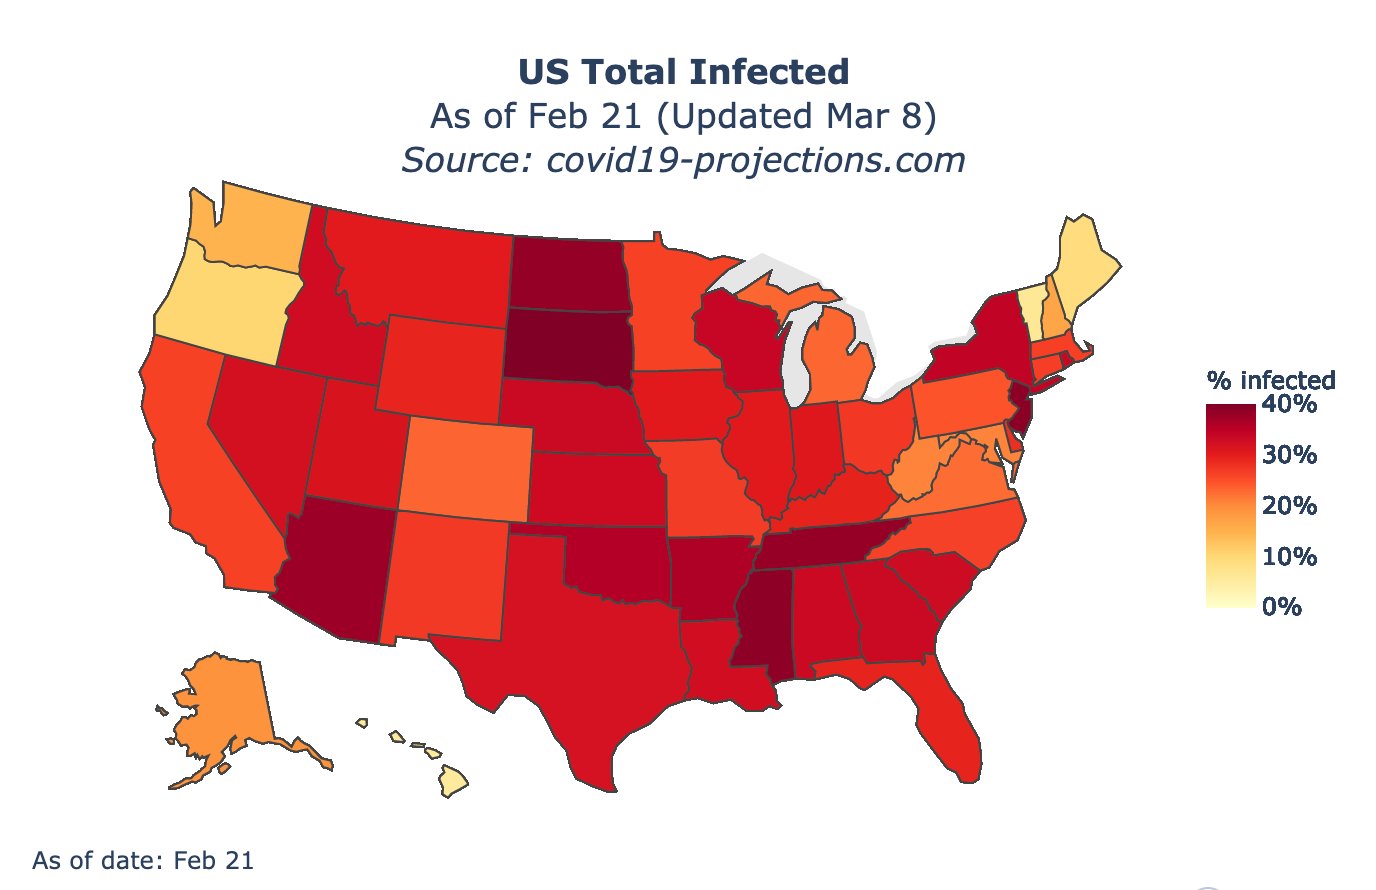
The following map shows the total coronavirus infection level per US state by late February 2021, as projected (i.e. not measured) by Covid19 Projections. The infection attack rate was lowest in the northwestern and northeastern corners (5% to 15%) and highest in South Dakota (47%).

Projected coronavirus infection attack rate in US states by February 2021 (covid19-projections.com)
2) Age-adjusted mortality, 1900-2020

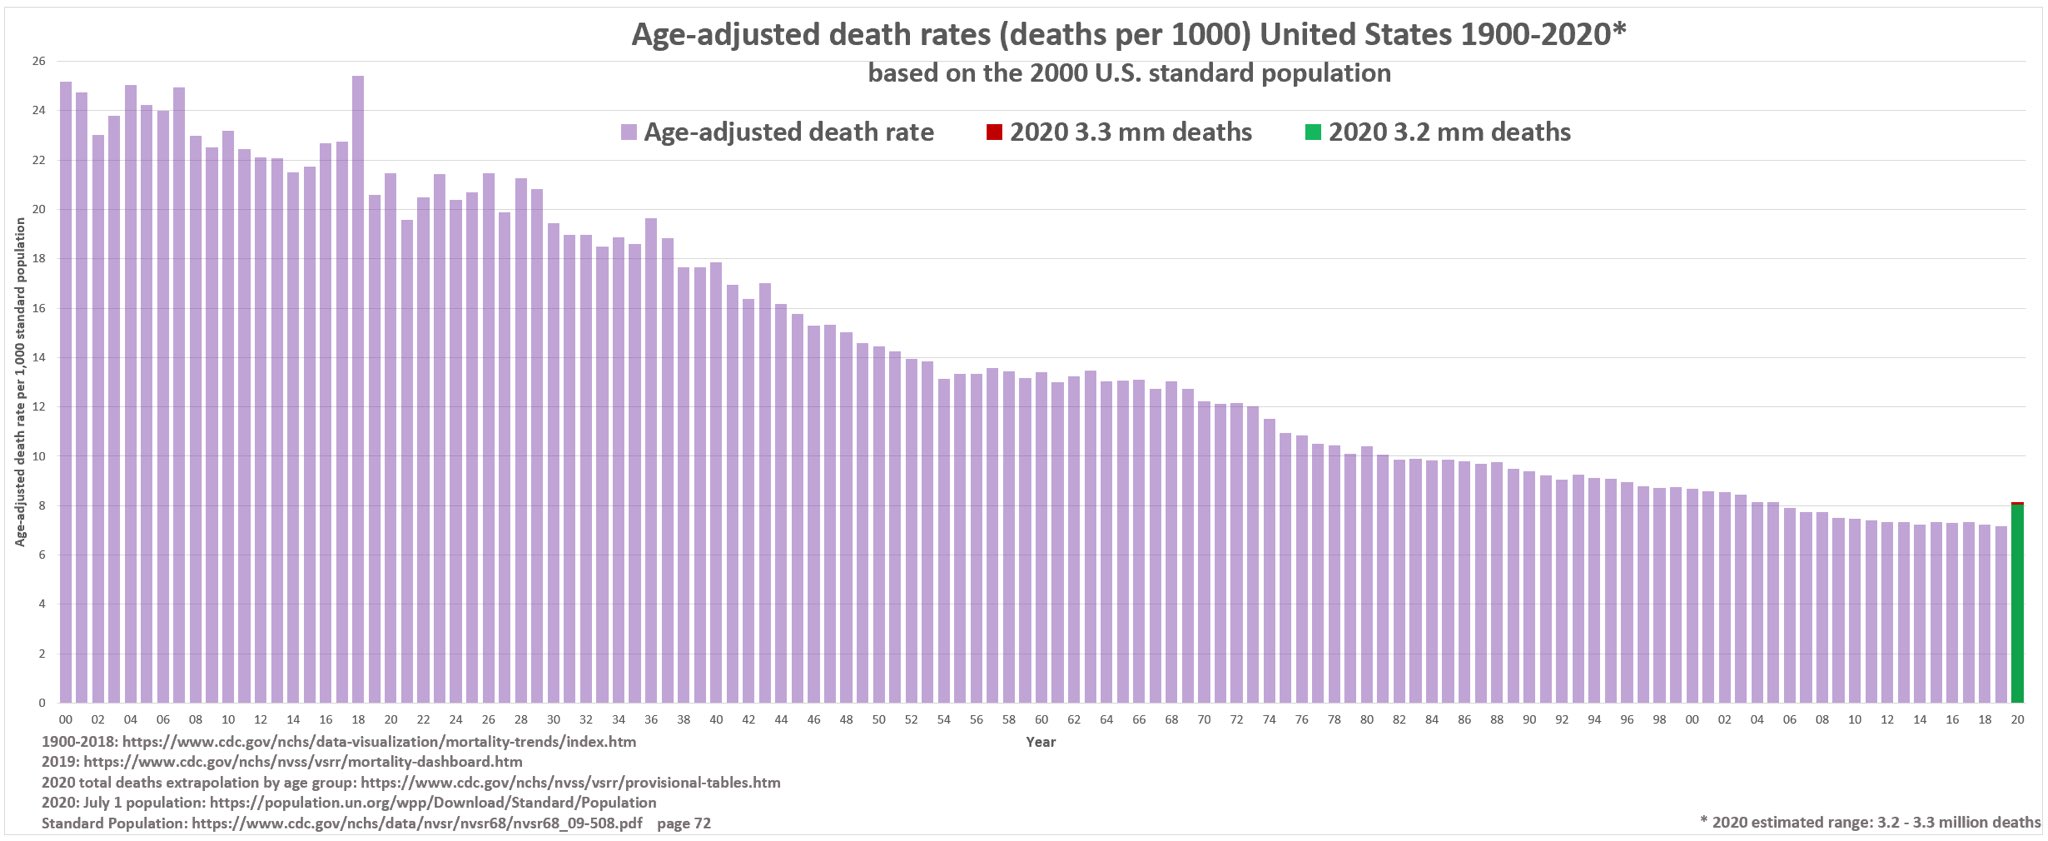
The following chart shows US age-adjusted mortality form 1900 to 2020. To take population ageing into account, the mortality of each year was applied to the US standard population of the year 2000. US age-adjusted mortality in 2020 was similar to mortality in 2004.

US age-adjusted mortality, 1900-2020 (Norwood/CDC)
3) Covid deaths by age group

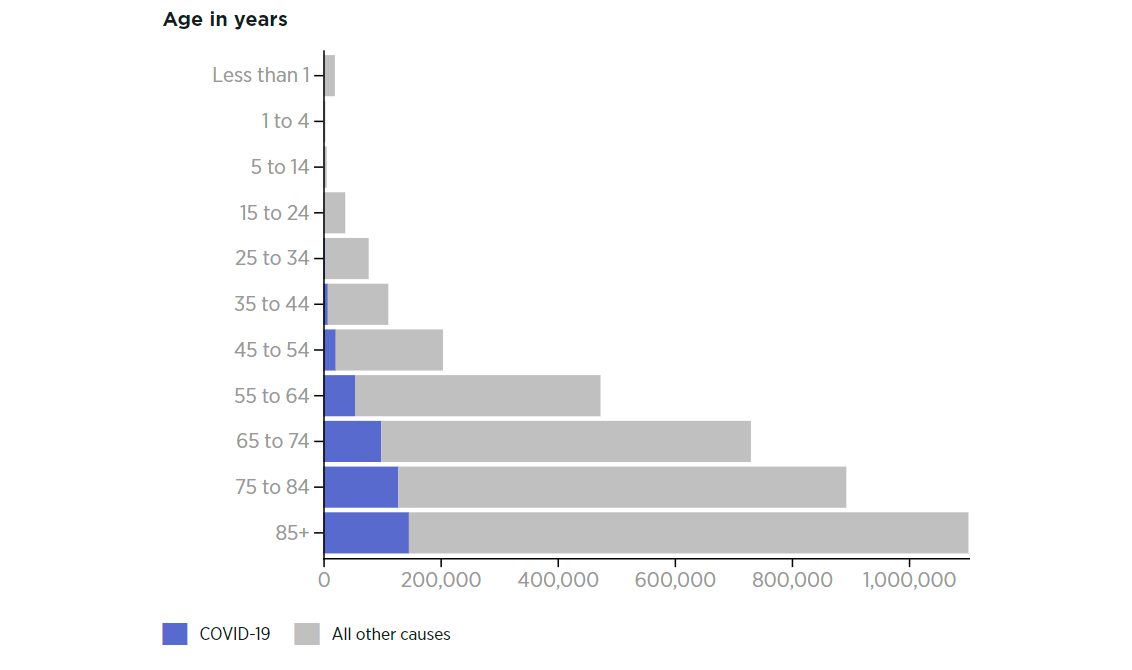
The following chart shows the number of US deaths from or with covid (blue) and from all other causes (gray), per age group, from February 2020 to February 2021, based on CDC data:

USA: Deaths from covid and all other causes, per age group, February 2020 to February 2021 (Heritage/CDC)

.

Coronavirus Covid-19 Research History – Index

.
Specific Issues Index

from Creating Better World

Posted in coronavirus, Covid-19, pandemic | Tagged , , , , , , , | Leave a comment

Pre-symptomatic transmission is very real

Pre-symptomatic transmission is very real

Fact or fiction? Pre-symptomatic transmission of the coronavirus (MIT Medical, May 2020)

Published: June 2021
Updated: August 2021
Share on: Twitter / Facebook
Select LanguageDutchEnglishFrenchGermanGreekHebrewHungarianItalianJapaneseKoreanPolishPortugueseRussianSpanishSwedishTurkishPowered by

Pre-symptomatic transmission is real. But face masks still don’t work.

Because many authorities justified mask mandates with pre-symptomatic or asymptomatic coronavirus transmission, many skeptics and critics tried to argue against the existence or importance of pre-symptomatic and asymptomatic transmission. But pre- and asymptomatic transmission is real for the same reason that face masks don’t work: aerosols.

In fact, numerous studies have shown that Sars-CoV-2 respiratory viral load peaks shortly before or shortly after symptom onset (see diagrams below). Once symptoms become apparent, it means the immune system has kicked in and viral load decreases rapidly.

The idea that only symptomatic people spread viral particles, by sneezing or coughing, is based on the obsolete ‘droplet model’ of virus transmission. In reality, transmission occurs primarily, and perhaps almost exclusively, via inhaled aerosols produced when breathing, talking, singing, coughing, or whatever. Droplets, by definition, cannot be inhaled.

Skeptics often point to a famous Wuhan study, published in November 2020 in Nature Communications, that allegedly showed that asymptomatic transmission is a myth, as even a commentary in the BMJ argued. In reality, the Wuhan study was a post-lockdown PCR study which tested 10 million Wuhan citizens in late May 2020 and found 300 who still had a positive PCR test.

But as the study notes, none of these people had positive virus cultures. Thus, these 300 cases were classic post-infectious high-CT PCR positives, who obviously couldn’t infect anyone anymore. In other words, the famous Wuhan study said nothing at all about pre- and asymptomtic transmission.

(Another common misunderstanding about Wuhan is the idea that the city turned into a major coronavirus hotspot. In reality, antibody seroprevalence in Wuhan was only about 1% to 5% by May 2020. At the same time, New York City had already a seroprevalence of at least 20%.)

Pre-symptomatic transmission is already well known from influenza, and it would have been truly surprising if it had played no role at all in the case of the new coronavirus. Indeed, it looks like pre-symptomatic transmission is even more important in the case of the new coronavirus, with estimates ranging between 30% and 60% of all virus transmission.

Pre-symptomatic or “stealth” transmission is also a major reason why Sars-Cov-2 could spread so rapidly and create a global pandemic. The real ‘myth’, or rather exception, might be sick people coughing straight into the faces of healthy people.

In contrast to transmission by pre-symptomatic people (i.e. a few days or hours before symptom onset), transmission by people who remain fully asymptomatic is a bit more complex to evaluate, because this group includes some people with a low viral load, which makes them less contagious. In addition, fully asymptomatic people are much more difficult to detect. However, nobody knows beforehand if they will develop symptoms or not, and as a Swedish doctor recently showed, even fully asymptomatic transmission has been documented in several carefully designed studies.

In conclusion, pre-symptomatic aerosol transmission is very real and has played an important role in driving the coronavirus pandemic. For the very same reason, face masks, ‘temperature screening’, reactive lockdowns, and even ‘contact tracing’ (beyond the very early phase) have not worked.

Postscript

1) “The abundance of this speech-generated aerosol, combined with its high viral load in pre- and asymptomatic individuals, strongly implicates airborne transmission of SARS-CoV-2 through speech as the primary contributor to its rapid spread.” (‘Breathing, speaking, coughing or sneezing: What drives transmission of SARS-CoV-2?’, Stadnytskyi et al, JIM, June 2021)

2) The Australian coronavirus outbreak in June 2021 confirmed the key role played by pre-symptomatic aerosol transmission: in a major Sydney cluster, a pre-symptomatic person infected an entire birthday party of 24 people; a pre-symptomatically infected flight attendant went on five domestic flights before testing positive; and an infected nurse traveled for 10 days before testing positive, having already infected several of her contacts.

3) Even in hospitals, pre-symptomatic aerosol transmission may drive outbreaks: “In this context, our cases consolidated the importance of presymptomatic transmission in the nosocomial outbreak, suggesting that the contact tracing period should be as early as 4 to 5 days before symptom onset.” (Jung et al, ICJ, June 2021)

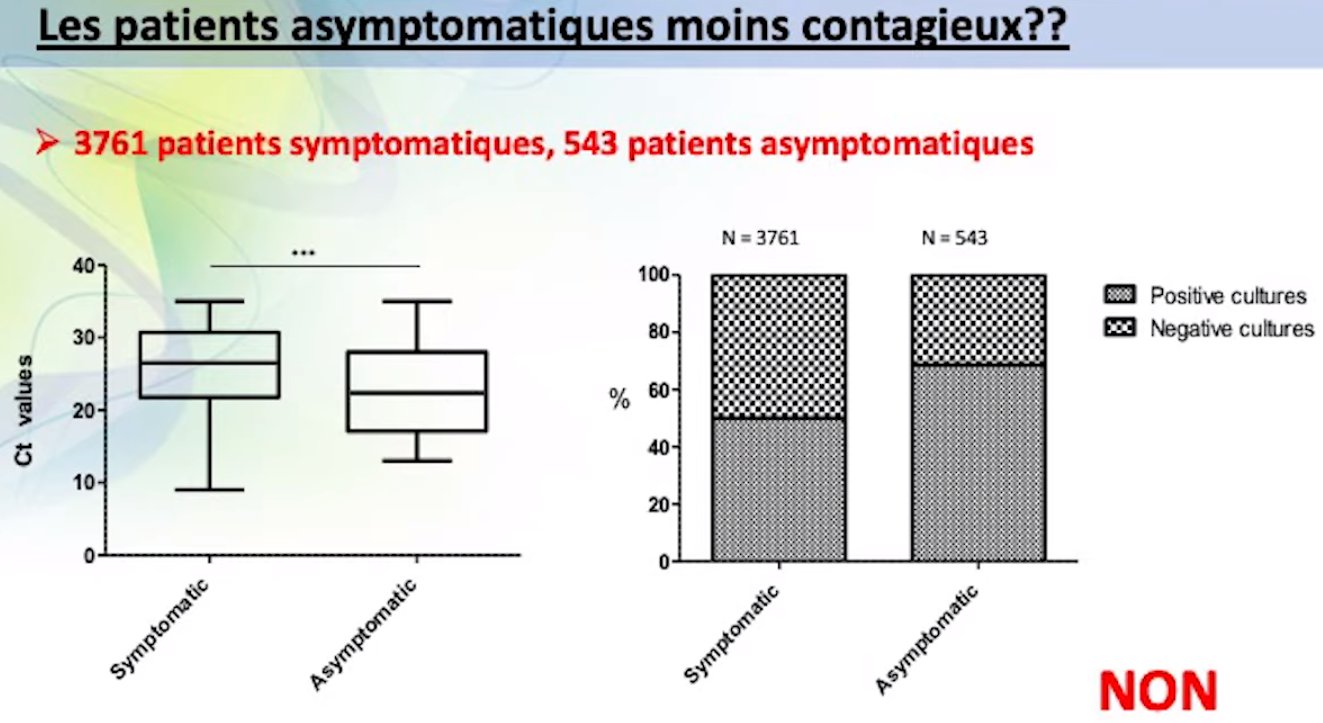
4) A French research group found that there was no significant difference in viral load and positive virus cultures between symptomatic and asymptomatic people.

Viral load (ct) and positive virus cultures in (non) symptomatic people (IHU)

Scientific diagrams

A) Viral load and culture probability over time

Rapidly decreasing viral load and (especially) infectiousness.

Viral load and estimated infectious virus shedding time series (Jones et al, May 2021)
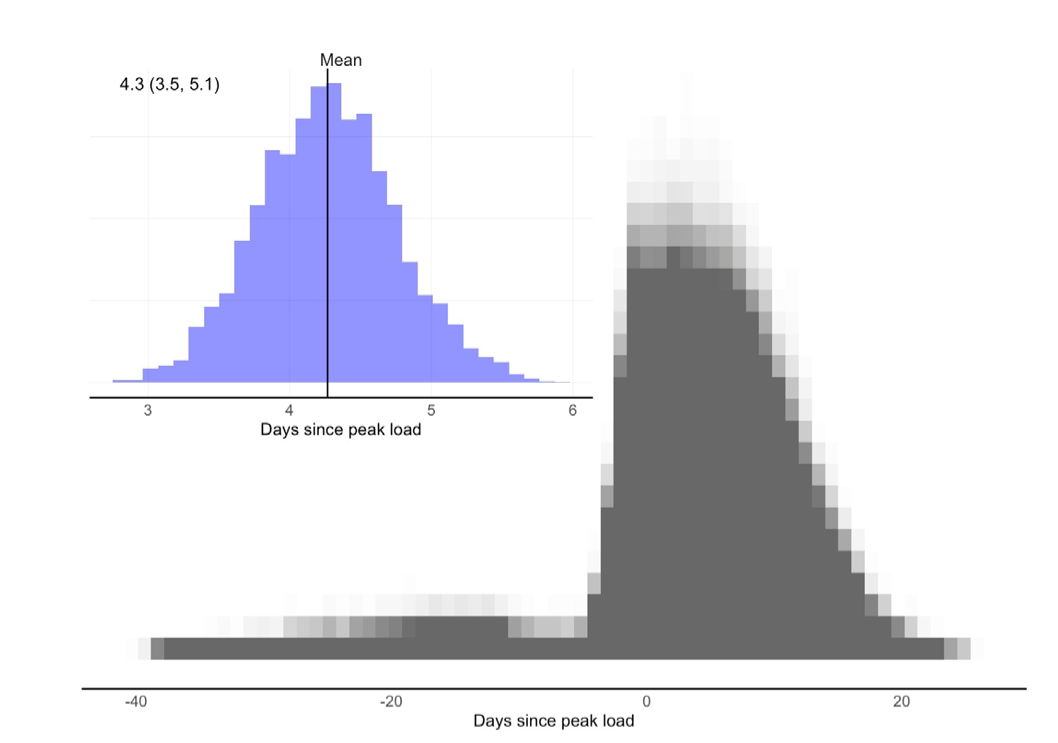
B) Symptom onset compared to peak viral load

Mean delay between peak viral load and self-reported symptom onset is 4 days.

Patient-reported onset of symptoms compared to estimated day of peak viral load (Jones et al, May 2021, Figure S15)
C) Temporal pattern of viral shedding

Rapidly decreasing viral load (PCR ct value) after symptom onset.

Temporal patterns of viral shedding (He et al, April 2020)
D) SARS-1, SARS-2, MERS: Viral load vs. symptom onset

SARS-2: Peak viral load near symptom onset – easy transmission. SARS-1 and MERS: Viral load increases only after symptom onset – poor transmission.

SARS-1, SARS-2, MERS: Respiratory viral load by day of symptom onset (Benefield, September 2020)
E) Aerosols: Respiratory pathogen transmission routes (2018)

Aerosols as the primary mode of transmission, even at close range.

Respiratory pathogen transmission routes (Ian Mackay, 2018)

.

Coronavirus Covid-19 Research History – Index

.
Specific Issues Index

from Creating Better World

Posted in coronavirus, Covid-19, pandemic | Tagged , , , , , , , | Leave a comment

Why Covid-19 Is a “Strange Pandemic”

Why Covid-19 Is a “Strange Pandemic”

Covid mortality (solid) and natural mortality (dashed) in men (red) and women (blue) (Spiegelhalter)

Published: September 2020 (updated)
Share on: Twitter / Facebook
Select LanguageDutchEnglishFrenchGermanGreekHebrewHungarianItalianJapaneseKoreanPolishPortugueseRussianSpanishSwedishTurkishPowered by

Why does covid-19 appear to be a somewhat strange pandemic? It is because of the covid-19 mortality profile, which is almost identical to natural mortality.

To better understand this crucial point, we first look at two other well-known pandemics: the 2009 swine flu “fake pandemic” and the notorious 1918 “Spanish flu” pandemic.

The 2009 swine flu was a “fake pandemic” because in reality it was a rather mild flu that caused few deaths globally. It was labeled a “pandemic” in June 2009 only because the WHO had removed the requirement of “enormous numbers of death and illness” one month before. The pandemic warning then triggered a multi-billion dollar sale of rather useless and partially dangerous vaccines.

The 2009 swine flu strain was mild because it was somewhat similar to a flu virus strain that had circulated prior to the 1957 Asian flu pandemic. This meant that most people over 60 years – the main risk group – had already developed immunity against the new virus. And the virus simply wasn’t dangerous enough to seriously threaten many people younger than 60 years.

The 1918 “Spanish flu” virus, on the other hand, was a very dangerous virus that had a very different mortality profile. In addition to old people, it also killed babies and young children plus young adults between 20 and 45 years at very high rates (see chart at the bottom).

In contrast, the mortality profile of the covid-19 coronavirus is essentially zero for children and young adults and near zero below 50, before it begins to rise slowly and then very steeply above 70 and especially above 80, reaching extreme levels in nursing homes.

Thus the covid-19 mortality profile is almost identical to natural mortality. This doesn’t mean that covid-19 doesn’t increase someone’s risk of death – it absolutely does – but this increase is proportional to the pre-existing risk of death of the respective age and risk group.

The characteristics of covid-19 may have to do with the cardiovascular and immunological effects of the virus and they explain the high death rate in nursing homes (up to 70% of deaths), in people above 70 years (about 90%), and in Western countries in general. In contrast, covid death rates in Africa, predicted by many (including Bill Gates) to be high, have been very low.

Many people expect a “real pandemic” to kill also younger people, or at least babies, at a significant rate, as the 1918 flu and other flu pandemics indeed did. Some skeptics therefore concluded that covid-19 must then be another “fake pandemic”. But it is not – it simply has a very different and much more “natural” mortality profile.

If covid-19 had hit us in the 1950s – with a much younger population, few nursing homes, and a much lower prevalence of cardiovascular disease – it would have caused rather few deaths.

Because of the covid-19 mortality profile, mass PCR testing and contact tracing in the general population make little sense and create an additional “casedemic” on top of the pandemic. Mass vaccinations will also make rather little sense, especially because at the time experimental vaccines might become available, many people may already have been exposed to the wild virus.

However, the mortality profile of covid-19 is only “the tip of the iceberg”. Covid-19 is also causing many standard and intensive care hospitalizations – even in people below 65 years – and it is causing post-acute “long covid” in about 10% of symptomatic people, including many young and healthy people. These are potentially serious issues that should not be downplayed in any way.

The best currently available answer to these issues is evidence-based early and prophylactic treatment, as emphasized by many leading experts from around the world. Simply isolating sick people at home until they cannot breathe anymore is the worst possible approach. Unfortunately, in many Western countries, it continues to be the most common approach.

It is important to keep in mind that in many parts of Europe and some parts of the US, coronavirus antibody values are still very low (e.g. 2% in Germany). Hence it is not reasonable at all to assume that the pandemic is already over. Even in global hotspots with a 20% antibody rate, it is not at all certain if this is going to provide collective immunity during winter months.

The following chart by Cambridge statistics professor David Spiegelhalter compares covid mortality (solid line) to natural mortality (dashed line) in men (red) and women (blue). As mentioned above, covid does increase the risk of death – covid mortality comes on top of natural mortality – but this increase is proportional to natural mortality.

Covid mortality (solid) and natural mortality (dashed) in men (red) and women (blue) (Spiegelhalter)

The following chart shows US mortality by age in previous pandemic years compared to 2020 US excess mortality, which consisted primarily (>75%) of confirmed and suspected covid-19 deaths, according to the CDC. To learn more about this comparison, please read this article.

Pneumonia and influenza mortality by age in previous pandemic years (Glezen, 1996) vs. 2020 excess mortality by age, primarily driven by covid-19, overall and excluding nursing homes (SPR based on CDC data)

.

Coronavirus Covid-19 Research History – Index

.
Specific Issues Index

from Creating Better World

Posted in coronavirus, Covid-19, pandemic | Tagged , , , , , | Leave a comment

The failure of PCR mass testing

The failure of PCR mass testing

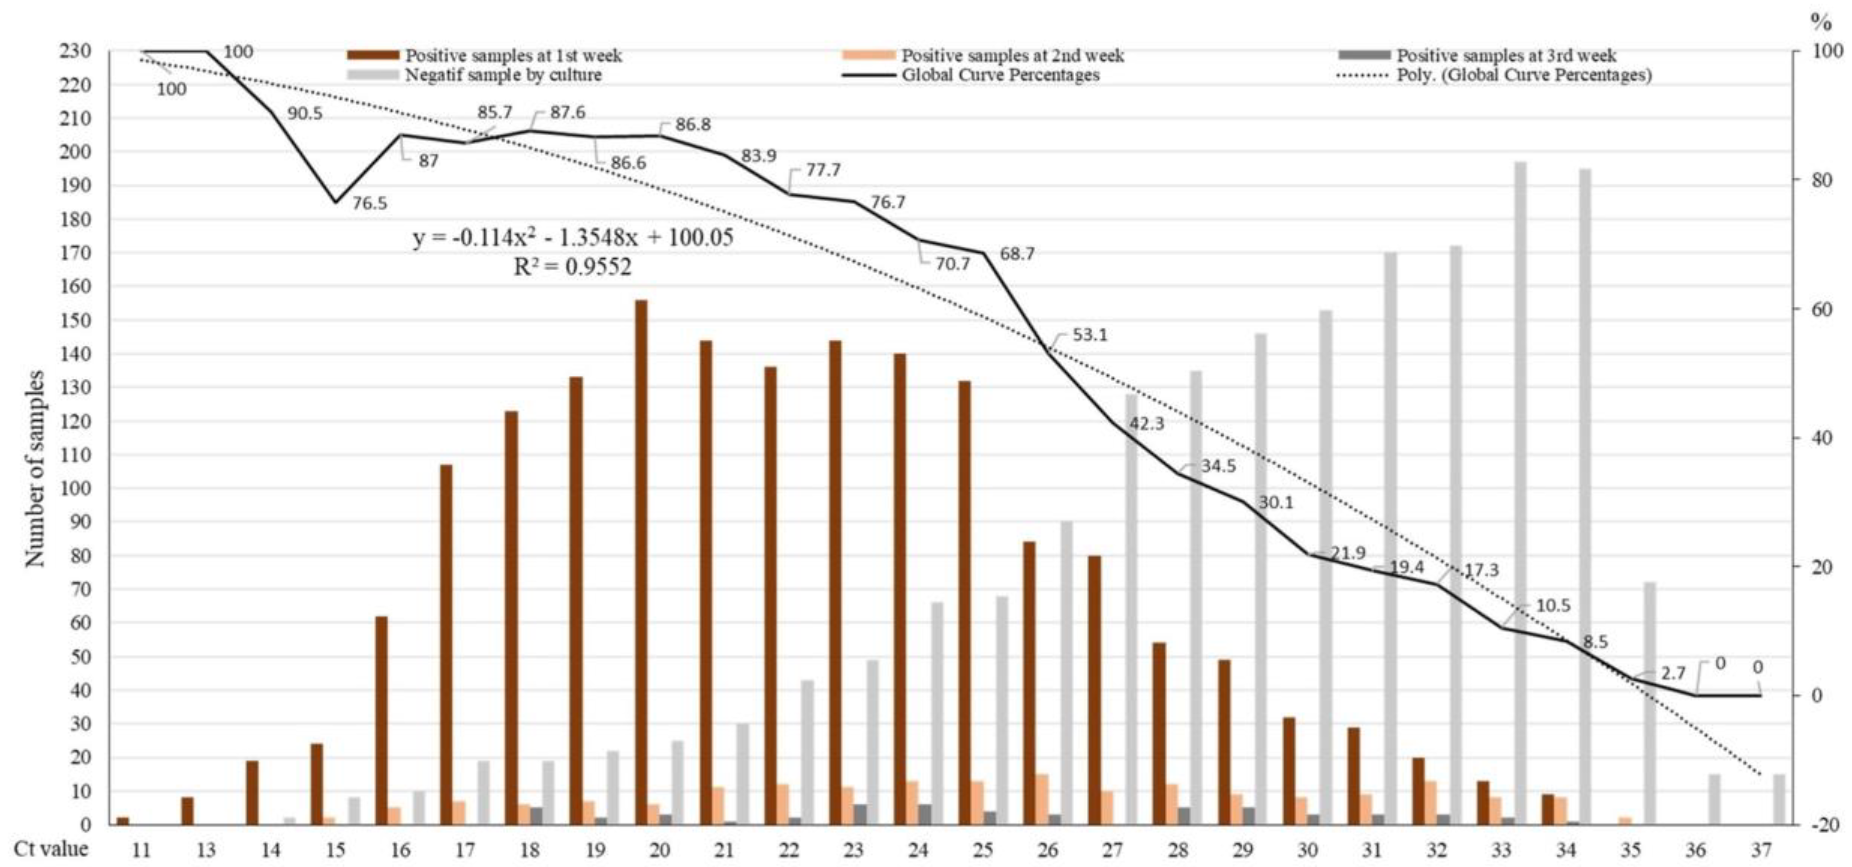
PCR cycle threshold (11-37) and positive cell culture (black line, 100% to 0%). The colored bars indicate the number of positive cell cultures per ct per week after infection (1 to 3 weeks). (Jafaar/Raoult)

Published: June 19, 2021
Share on: Twitter / Facebook
Select LanguageDutchEnglishFrenchGermanGreekHebrewHungarianItalianJapaneseKoreanPolishPortugueseRussianSpanishSwedishTurkishPowered by

A new German study confirms and explains the failure of PCR mass testing.

In March 2020, SPR warned that PCR mass testing in the general population (“test, test, test”) would be a serious mistake. The issue never was that PCR tests didn’t work or that the Drosten PCR paper was “peer-reviewed” in just one day. The issue is that PCR tests cannot determine an acute infection, ongoing infectiousness, and actual disease, especially if ct values are not taken into account.

Several studies have since shown that national PCR testing rates have had no influence at all on covid mortality. In addition, a new German study re-analyzed PCR tests of 160,000 people and concluded:

“In light of our findings that more than half of individuals with positive PCR test results are unlikely to have been infectious, RT-PCR test positivity should not be taken as an accurate measure of infectious SARS-CoV-2 incidence. Our results confirm the findings of others that the routine use of ‘positive’ RT-PCR test results as the gold standard for assessing and controlling infectiousness fails to reflect the fact ‘that 50-75% of the time an individual is PCR positive, they are likely to be post-infectious.’” (Stang et al, Journal of Infection, May 2021)

Why has mass PCR testing failed so badly? Most likely because of the role of pre-symptomatic transmission: by the time someone gets a ‘positive’ test result, the infectious virus is already being neutralized, or in some cases is already long gone. Hence PCR testing really only makes sense in targeted, preemptive high-risk settings, such as hospitals, nursing homes or early border controls, or possibly in Chinese-style preemptive, pooled mass testings of entire 10-million-people cities.

Overall, PCR mass testing has achieved essentially nothing but hundreds of billions in unnecessary costs and large-scale psychological trauma, especially in children. Nevertheless, with millions of deaths, covid was not just a “casedemic” or a “fake pandemic” (as the 2009 swine flu), but a PCR-driven “casedemic” on top of a real pandemic – or, as previously noted: a “strange pandemic”.

Related: The trouble with PCR tests (October 2020)

.

Coronavirus Covid-19 Research History – Index

.
Specific Issues Index

from Creating Better World

Posted in coronavirus, Covid-19, pandemic | Tagged , , , , , , , | Leave a comment

Obesity and The Pandemic: New Insights

Obesity and The Pandemic: New Insights

Obesity rates in women (WHO, 2014)

Published: June 10, 2021
Share on:  Twitter / Facebook
Select LanguageDutchEnglishFrenchGermanGreekHebrewHungarianItalianJapaneseKoreanPolishPortugueseRussianSpanishSwedishTurkishPowered by

Has obesity driven not just covid mortality, but the pandemic itself?

Several studies have shown that obese people not only have a higher covid fatality risk, but they also have higher viral loads, exhale more bioaerosols, and do so for a longer period of time. Thus, could obesity have driven not only covid mortality, but the pandemic itself? And could the near-absence of obesity in some East Asian countries explain their remarkable resilience against the covid pandemic?

Please note: This is a scientific analysis; it does not support “fat shaming”.

A) Covid mortality and age

Covid fatality rates in the entire population vs. non-nursing home population (Molenberghs)

The preferred framework for explaining covid mortality usually has been age: the older a person, the higher the infection fatality rate. The older the average age of a population, the higher, allegedly, covid mortality (assuming equal infection prevalence).

However, if one excludes the nursing home population in Western countries – which accounts for about 50% of Western covid deaths, but only about 1% of the overall population – the age-gradient of the covid infection fatality rate is actually much less steep than is commonly assumed (see the chart above).

Furthermore, if one excludes Western nursing homes, the covid IFR in the general population is in fact not that much different between, for instance, Europe, the US, South Africa, Latin America and India (about 0.2% to 0.5%).

In most countries, the median age of covid deaths is quite close to the average life expectancy of the country in question, e.g. 80+ in Western Europe, 78 in the USA, 70 in Brazil, and 62 in South Africa. Indeed, the young average age of many Latin American countries, South Africa or India has not at all protected these countries against high covid mortality rates.

It is well known that Sars-Cov-2 uses the ACE2 cell receptor, which is primarily a receptor of the endothelium and the cardiovascular system. Hence it is reasonable to assume that covid severity may be linked to cardiovascular and metabolic health, which is indeed the case.

Given this association, one may argue that the residual age-gradient of covid fatality rates in the non-nursing home population may be driven, to a significant extent, by cardiovascular and metabolic health. In addition, the status of being a nursing home resident may itself be closely associated with poor cardiovascular health and with general frailty.

It should be noted that many generally healthy people over 100 years of age, and up to 117 years of age, have already survived a covid infection, which may also speak against “age” as a paramount risk factor of itself. Indeed, among the five countries with the highest life expectancy in the world, we find Japan, South Korea and Singapore, all of which have very low covid mortality rates.

In conclusion, it may be argued that age, in itself, may not be the primary factor determining covid fatality rates. Instead, cardiovascular and metabolic health, of which obesity rates may be seen as a reasonable proxy value, should be considered.

B) Obesity and covid mortality

Top: Obesity rates in women (WHO, 2014). Bottom: Excess mortality during the pandemic (Economist, May 2021)

The above chart compares obesity rates in women (which are more pronounced than in men) to total excess mortality between March 2020 and May 2021. In most countries, excess mortality during the pandemic has primarily been driven by covid mortality (exceptions see below).

The following country analysis is based on the list of countries by obesity rate (WFB/Wikipedia) and the overview of global excess mortality rates (estimated by ‘The Economist’).

In many countries, high obesity rates are associated with high covid mortality rates. This includes the United States (36% obesity rate); most of Europe, in particular the UK (28%) and large parts of Eastern Europe (e.g. the Baltic states, Poland, Hungary, Czechia, Bulgaria; all 23% to 26%); Russia (23%) and Kazakhstan (21%); most of Latin America (including Mexico and Peru; 20% to 30%); South Africa (28%); as well as Turkey, Iraq and Iran (26% to 32%).

A few countries have high obesity rates, but low covid mortality rates. This group includes Canada, Australia and New Zealand (all 30%), and some Arab countries (notably Algeria and Saudi Arabia, at 28% and 35%). In the case of Canada, Australia and New Zealand, it is clear that these countries have managed to keep covid infection prevalence low due to strict border management; otherwise, their covid mortality would most certainly have been quite high. In the case of the Arab states, infection prevalence is not known, but the example of Bahrain (30%) indicates rather high mortality rates.

(Update: The latest edition of the Economist’s global excess mortality analysis shows that Saudi Arabia in fact has very high excess mortality, consistent with their very high obesity rate.)

Next, there are countries with a low obesity rate and a low covid mortality rate. Very significantly, the countries which proved to be highly resilient against the covid pandemic are also the countries with the lowest obesity rates in the world: Vietnam, Bangladesh, Cambodia, Japan, South Korea and Laos (all below 5%), Singapore, the Philippines and Indonesia (5% to 7%), and Thailand (10%), as well as many Black African countries (5% to 10%), but not South Africa (28%, see above).

Finally, there are a few countries with an apparently low obesity rate, but a not-so-low excess mortality rate. This group includes India and Nepal (both 4%) and some countries in central and eastern Africa (5% to 10%). However, a closer look into Indian obesity rates reveals that, while the national obesity rate is very low, it is in fact very high in urban areas (reaching 20% to 50%). While this ‘urban obesity effect’ may apply to some other countries, too, it seems to be particularly pronounced in India.

Nepal  seems to be a real outlier; it has seen a major infection and mortality wave, but only in the spring of 2021, driven by the more infectious “Indian variant” of the coronavirus. Is the “Indian variant” perhaps more infectious than the original “Wuhan variant” because it is more infectious in non-obese people? Did Sars-Cov-2 get better at transmitting from lean people?

In the case of African countries with low obesity rates but elevated excess mortality, it is difficult to say if excess mortality was due to covid or due to other factors (e.g. hunger, tuberculosis, malaria).

In China, the national obesity rate is still low (6%), but reaches levels greater than 20% in some cities. Due to extreme Chinese lockdowns and a general lack of reliable prevalence and mortality data, it is difficult to say in which of the above groups China belongs.

In conclusion, it looks like obesity rates are indeed strongly associated with covid mortality rates. Most supposed ‘exceptions’ are easily explained. The biggest question marks concern some Arab states (notably Saudi Arabia, where infection prevalence is not known), Nepal, and China.

C. Obesity and covid infections

Exhaled aerosols compared to BMI and age (Edwards et al)

In addition to a higher fatality risk, studies have shown that people with obesity also have a higher viral load and do so for a longer period of time. It has been argued that this may be because of a higher concentration of ACE2 cell receptors in adipose tissue. Furthermore, studies have shown that exhaled bioaerosols increase with age and body mass index (BMI), as is shown in the chart above.

In sum, given that Sars-Cov-2 appears to be transmitted primarily via aerosols, and that pre-symptomatic transmission appears to play an important role (30% to 60% of all transmission), this could mean that obesity (and possibly excess weight in general?) could drive coronavirus infections, the frequency of “super-spreading” events, and the covid pandemic in general.

If so, this could explain why the countries with the lowest obesity rates in the world – such as Vietnam, Bangladesh, Cambodia, Japan, South Korea and Laos (all below 5%) – appear to have been exceedingly resilient against the covid pandemic, with a very low coronavirus infection prevalence, morbidity and mortality (although the new “Indian variant” might pose a challenge to them).

It could also explain why, in contrast, countries with high obesity rates have often seen very explosive, nation-wide outbreaks of coronavirus infections (e.g. in Latin America, in the US, and also in Eastern Europe in the autumn of 2020), followed by high covid morbidity and mortality.

Ironically, many Western countries assumed that the success of East Asian countries was due to face masks, only to find out that face masks have had no impact at all on coronavirus infection rates (as was already known from influenza epidemics).

Conclusion

The potential link between obesity rates and the rate of covid infections, morbidity and mortality should be further investigated in order to elucidate the dynamics of the coronavirus pandemic.

(See postscript below.)

Japanese citizen Chitetsu Watanabe, at the time the oldest living man, died on February 23, 2020 at the age of 112 – though apparently not from covid. (CNN)

Postscript: Obesity and influenza

Interestingly, a similar relationship between obesity and infectiousness was already found in the case of influenza:

“Why are obese patients potentially more contagious than lean subjects? Three factors make obese subjects more contagious than leans:

  • First, obese subjects with influenza shed the virus for a longer period of time (up to 104% longer) than lean subjects, potentially increasing the chance to spread the virus to others [22].
  • Secondly, the obese microenvironment favors the emergence of novel more virulent virus strains. This is due mainly to the reduced and delayed capacity to produce interferons by obese individuals and animals [17, 18]. The delay in producing interferon to contrast viral replication allows more viral RNA replication increasing the chances of the appearance of novel, more virulent viral strains [18].
  • Thirdly, body mass index correlates positively with infectious virus in exhaled breath [23]. This finding was especially significant for males, which leads to the hypothesis that the higher ventilation volumes or a differential chest conformation might explain this fact”

Source: Influenza and obesity: its odd relationship and the lessons for COVID-19 pandemic (Luzi & Radaelli, Acta Diabetologica, April 2020)

Update

.

Coronavirus Covid-19 Research History – Index

.

Specific Issues Index

from Creating Better World

Posted in coronavirus, Covid-19, pandemic | Tagged , , , , , | Leave a comment

Coronavirus Variants: What’s Next?

Coronavirus Variants: What’s Next?

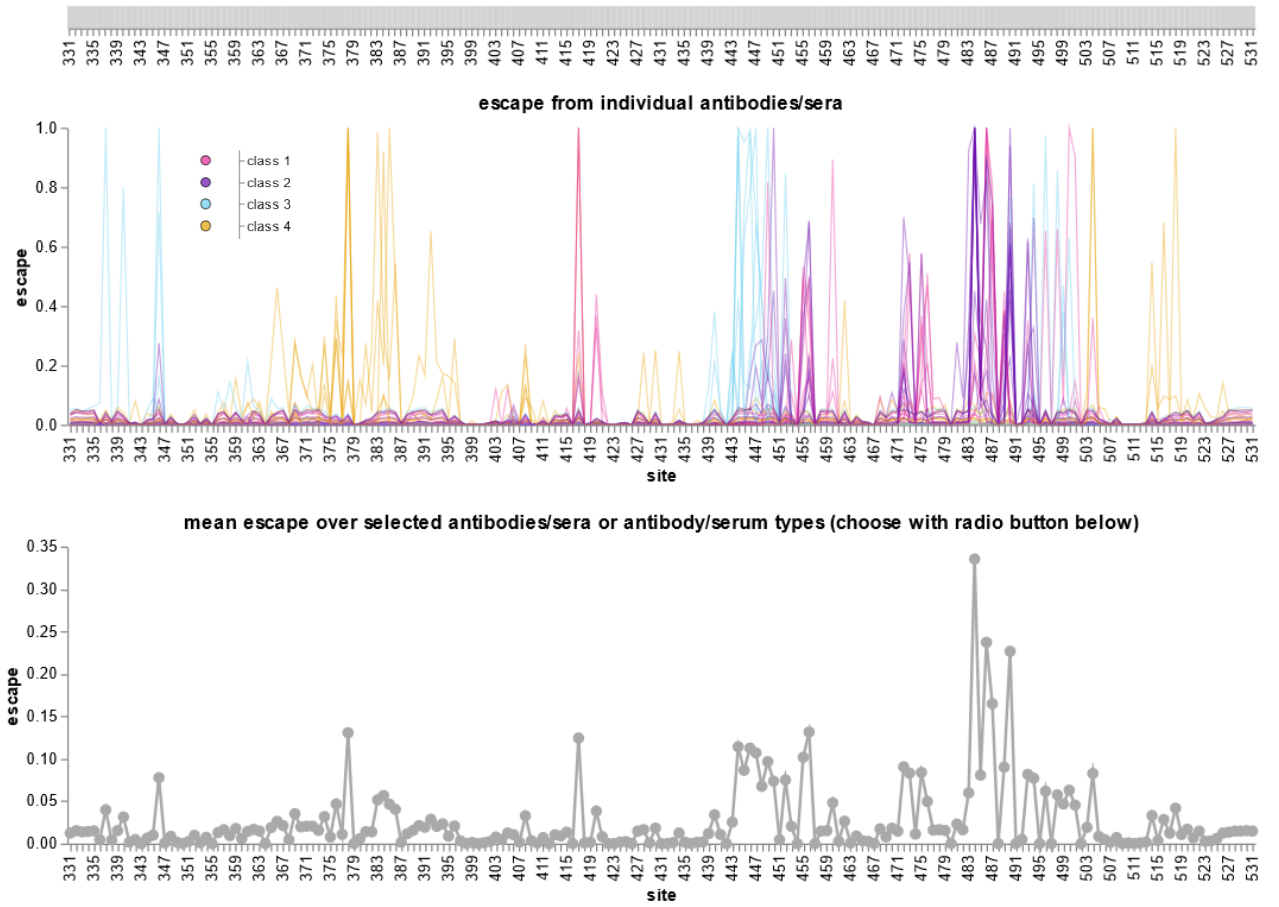
Coronavirus variants: Escape from antibody classes 1 to 3 (SPR, based on Greaney et al.)

Updated: November 2021
Published
: July 2021
Share on: Twitter / Facebook
Select LanguageDutchEnglishFrenchGermanGreekHebrewHungarianItalianJapaneseKoreanPolishPortugueseRussianSpanishSwedishTurkishPowered by

So far, no variant has achieved escape from all three major antibody classes.

(See update on the Omicron variant below).

Existing coronavirus variants – including the British, South African, Brazilian and Indian variants – have shown some gradual changes in infectiousness, virulence, and immune escape. Relative transmission advantages are often only transitory, until collective immunity has caught up.

Some of the existing variants – notably the South African, Brazilian, Nepalese and Peruvian variants – have managed to escape two out of three antibody classes, reducing vaccine effectiveness; but so far, no variant has managed to escape all three antibody classes (see update below).

Such a triple-escape variant may arrive next autumn or winter and could potentially lead to increased rates of vaccine breakthroughs and re-infections, especially in regions that have not yet faced the Brazilian or South African ‘class 2’ escape variants. The actual impact will also depend on the effectiveness of cellular immunity (T cells), which may be somewhat broader.

Furthermore, a triple-escape variant will, for the first time, raise the question of a potential antibody-dependent disease enhancement (ADE), as vaccinated people, in particular, will have very high levels of non-neutralizing antibodies, whose behavior remains somewhat uncertain. ADE has been observed with SARS-1 vaccine candidates, but not yet with SARS-2 vaccines.

In terms of escape mutations, the coronavirus has already played many of its best ‘cards’, including the powerful 484 escape mutation found in the South African, Brazilian and New York variants and the 490 mutation in the Peruvian variant. In terms of receptor binding affinity – which may or may not increase infectiousness and virulence – there are a few more options left (see charts below).

Existing and future coronavirus variants once again highlight the importance of effective and affordable early treatment options for high-risk people and low-income nations, as monoclonal antibody therapies are losing effectiveness and vaccines will require updated boosters.

See also: The Delta summer wave (June 2021)

Update November 2021: The Omicron variant, detected in November 2021 in South Africa, is the first coronavirus variant with escape mutations in all three major antibody classes (see above). This will likely reduce neutralization by existing vaccines and possibly by natural immunity.

Figures

1) Coronavirus escape mutations (per antibody class and overall)

Coronavirus escape mutations, per antibody class and overall (Bloom lab)

2) Coronavirus mutations increasing or decreasing ACE2 receptor binding affinity

Mutations increasing (blue) or decreasing (red) ACE2 receptor binding affinity. An increased receptor binding affinity may increase or decrease virulence and infectiousness.

Coronavirus mutations and their effect on ACE2 receptor binding affinity (Starr et al.)

3) RNA vaccines: Reduced neutralization against new virus variants

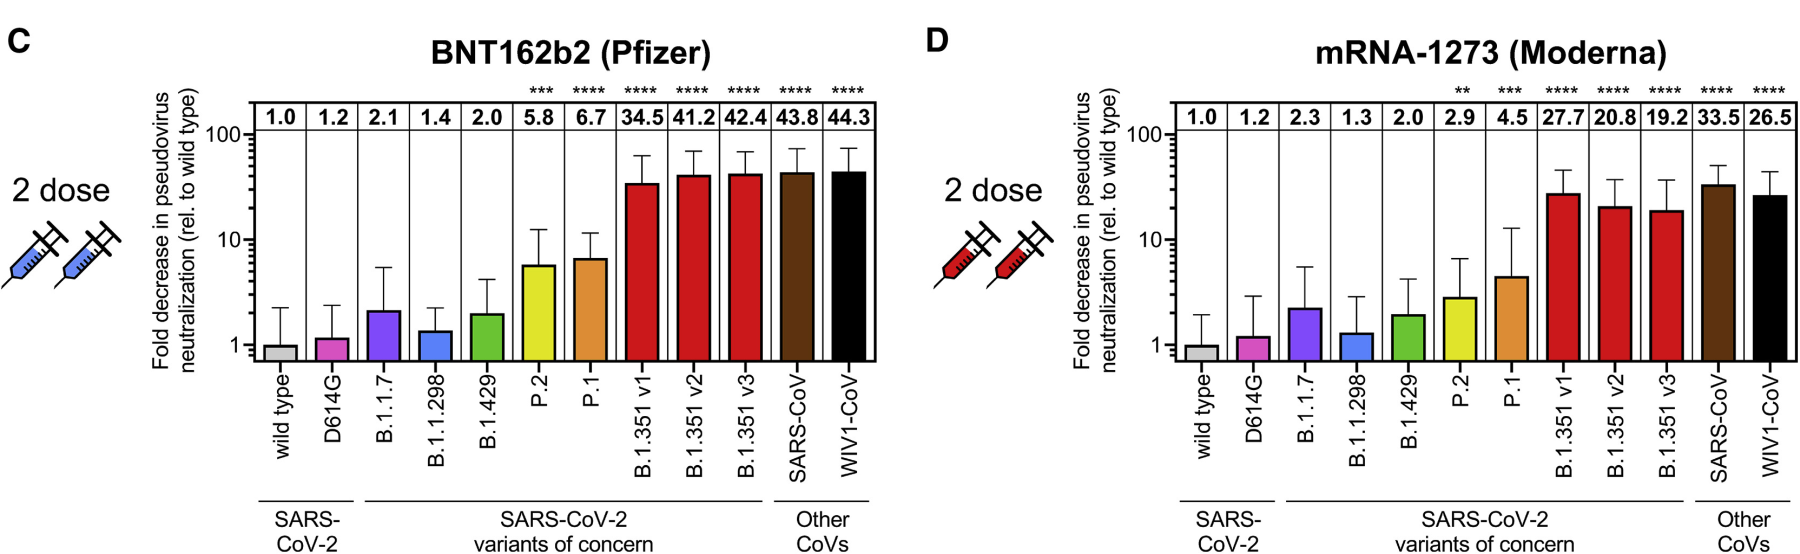
Covid RNA vaccines: reduction in neutralization of variants (x-fold reduction). P.1/P.2: “Brazilian” variants; B.1.351.V1-3: “South African” variants (Source: Garcia-Beltran).

Covid RNA vaccines: Reduction in neutralization of variants (x-fold reduction). P.1/P.2: “Brazilian” variants; B.1.351.V1-3: “South African” variants (Source: Garcia-Beltran)

.

Coronavirus Covid-19 Research History – Index

.
Specific Issues Index

from Creating Better World

Posted in coronavirus, Covid-19, pandemic | Tagged , , , , , , | Leave a comment

Are the new COVID-19 swab tests accurate?

Are the new COVID-19 swab tests accurate?

The last year has seen a flurry of announcements about rapid access swab tests. But what are the practicalities of having one of these new tests and should you trust them?

First there was the announcement about ‘Operation Moon Shot’ and the plan to screen up to four million people every day. Next came mass testing in Liverpool and then the rollout of rapid access testing for care homes. Over the same period, we saw dozens of private rapid access tests come on to the market.

At the start of the COVID-19 pandemic, the UK was way behind the curve when it came to testing. The only test available was the PCR (polymerase chain reaction) test, which is still the standard test used at NHS test sites. It involves taking a swab of the nose and throat, which is sent to a laboratory for analysis. For the first few months, there was a global shortage of both the swabs and the reagent used in lab testing for coronavirus. This was resolved within a few weeks, but because PCR tests need to be processed in a laboratory, it takes at least 24 hours to get a result back.

That’s why there has been a huge research focus into finding tests which tell you more quickly whether you’re infected. Several different types of rapid access test – including lateral flow and LAMP (loop-mediated isothermal amplification) tests – have been trialled with varying levels of success.

Do COVID-19 swab tests hurt?

Most tests to see whether you are currently infected with COVID-19 involve a swab of your nose, throat or both. The swab is like a soft cotton bud. The nose swab might feel slightly uncomfortable, and may make you want to sneeze. The throat swab might make you gag a bit, but neither test should be painful.

How does the coronavirus swab test work?

PCR testing

PCR swab testing involves collecting a sample and isolating RNA (the genetic code) of the virus – the COVID-19 virus is an RNA virus. RNA is similar to DNA (what humans use for their genetic code) but only has a single strand, rather than the double strand in DNA. PCR only works on DNA, but scientists can use enzymes to convert RNA into DNA.

This single copy of DNA is converted, using the PCR process, into millions of copies. This takes:

  • Enzymes to encourage chemical reactions.
  • Chemical building blocks of DNA.
  • Repeated cycles of heating (to separate the two strands of DNA produced), cooling and creating more DNA strands.
  • Time.

The signal from millions of copies can be picked up in testing. Clearly, if there is no COVID-19 RNA present, it can’t be converted into DNA or replicated.

Rapid access tests

Rapid lateral flow device (LFD) tests aren’t just used for COVID-19 – they can be used to test urine, saliva, sweat, fluid and other types of sample and the test is commonly used for pregnancy testing.

For COVID-19 tests, a ‘monoclonal antibody’ – which matches the virus or part of the virus exactly – is attached to a special strip in a test cartridge. Extracts of the swab sample are passed over the strip, and if COVID-19 antigen is present, it is picked up by the antibody and shows up as a coloured line. The Innova test, used in Liverpool and care home mass testing, is a rapid lateral flow test.

LAMP (loop-mediated isothermal amplification) tests work in a similar way to PCR tests. They convert viral RNA into DNA and copy it. However, they use chemical reagents and LAMP technology rather than heat: this produces a much larger amount of DNA more quickly, resulting in a colour change which allows the result to be interpreted.

How accurate are COVID-19 swab tests?

PCR testing

Even the PCR test isn’t 100% accurate. Scientists assess the accuracy of tests based on:

Sensitivity: how often people who have COVID-19 are identified as being infected. People who have ‘false negative’ tests are infected but have a negative result.

Specificity: how often people who do not have COVID-19 are told they are infected. People who have ‘false positive’ tests are not infected with COVID-19 but get a positive result (for instance, because they’re infected with a virus with a similar genetic code).

One review suggests false negative rates of 2-29% for PCR testing, based on a negative PCR test which later becomes positive.

Part of the problem lies with the amount of virus RNA present – at the early stages of infection, there may not be enough genetic material for an accurate positive test, even if you are infected with COVID-19. On average, people are most likely to test positive from a couple of days before they develop symptoms until about a week after symptoms begin.

Rapid access testing

PCR testing is the Gold Standard for sensitivity and specificity, and all the rapid access tests are compared with results of PCR testing.

Public Health England (PHE) has tested 40 different rapid access COVID-19 swab tests. Of these, all but nine fell at the first hurdle – they were found to have rates of false positive/false negative that were too high, or too many of the kits were faulty.

Innova
Of the 40 tests submitted to PHE, the Innova LFD test was the first passed for rollout. It was found to have a 99.6% specificity and high sensitivity compared to PCR.

OptiGene
Since the Innova test was approved, the Department of Health and Social Care (DHSC) has also passed the OptiGene RT-LAMP test. This test can be carried out using a nose/throat swab or using a saliva sample. Their report showed that compared to PCR:

  • The OptiGene test on nose/throat swabs had a sensitivity of 95% and a specificity of 99%.
  • The OptiGene test on saliva had a sensitivity of 79% and a specificity of 100%. However, among people with a higher viral load (those who are more likely to be infectious), the sensitivity rose to 94%.

LumiraDx
NHS Scotland is using LumiraDx – a microfluidic immunofluorescence assay which directly detects the presence of nucleocapsid proteins, uses a nasal swab and provides a COVID-19 test result in about 15 minutes. It compares with PCR positive tests in 97.6% of cases.

Abbott Panbio
On 23rd December 2020, following successful phase 2 testing, the Abbott Panbio LFD test has been compared with the Innova test in a PHE study for detection of new variant COVID-19. After it showed equivalent results, it is being used in field tests by the NHS.

SureScreen Diagnostics
On 11th January 2021, the DHSC announced that the government has ordered 2 million of the first British-manufactured LFD tests for COVID-19 (SureScreen DiagnosticsLFD test) to be validated by PHE.

Oxford Nanopore LamPORE
In January 2021, DHSC announced results of a trial for the Oxford Nanopore LamPORE testing technology used in pilot pop-up laboratories. They concluded that it is “highly effective” in detecting the virus in people with and without symptoms.

The asymptomatic pilot study recruited 1,200 healthcare workers across four hospitals. The results add to previous studies on symptomatic patients. They found:

  • A sensitivity of 100% and a specificity of 100% for swab samples from symptomatic patients.
  • A sensitivity of 99.6% and specificity of 99.4% for swab samples from asymptomatic patients.
  • A sensitivity of 98.9% and specificity of 99.4% for saliva samples from asymptomatic patients.

If you need to book a rapid access COVID-19 swab test, you can be reassured that the tests offered on Patient Access only include the makes above, which have been approved by PHE and/or have been chosen for use in the NHS.

Should I have a COVID-19 swab test?

PCR testing on the NHS

If you have possible symptoms of coronavirus, you should self-isolate and book a test via the NHS website. The standard swab test for current infection available on the NHS is a PCR test. This is available to people of any age in England and Wales with symptoms of coronavirus, or anyone in Scotland or Northern Ireland over 5 years of age with symptoms of coronavirus.

If you’ve been double vaccinated against COVID-19, you no longer need to self-isolate if you have been identified as a close contact of someone with COVID-19. However, you should get a PCR test as soon as possible and ideally self-isolate until you get a negative result. If your result is positive, you must self-isolate for at least 10 days from the date you had the test.

Lateral flow testing on the NHS

LFD tests are now widely available for students and teachers at secondary school, college and university. You can also get free LFD tests from participating pharmacies or online.

These are not suitable to certify you’re infection-free if you’re travelling abroad, and should not be used if you have symptoms. However, they give a good indication of whether you’re infected if you don’t have symptoms, and can offer reassurance that you’re not spreading the virus to others without knowing it.

Private swab tests

If you’re travelling abroad, you may be required to take a PCR or LFD test before you depart or on your return. These are not available on the NHS. Travel-compliant PCR and LFD tests are widely available through pharmacies, and you can book a private test directly on Patient Access. Pharmacies which provide swab testing through Patient Access only offer swabs which have been approved by PHE, DHSC or another national body.

It’s very important that you should not book a private swab test if you have symptoms of possible COVID-19 infection – NHS test centres are fully equipped with infection control measures which are not available in pharmacies.

The bottom line

It’s really important to remember that none of the existing tests is 100% sensitive. What’s more, they only give a snapshot of whether you have virus in your nose and/or throat at the precise time you have the sample taken. In addition, a self-administered test is much less likely to be accurate than one taken by a trained healthcare professional.

However, if you’re infected but have very low levels of virus, you’re probably much less likely to be infectious – capable of passing the virus on to others – even if you are infected. While the most reliable rapid access tests are slightly less sensitive than PCR testing, they’re almost as likely as PCR to be positive if you have a high viral load – ie if you’re very infectious.

Nonetheless, it’s still vital not to assume you can hug and kiss anyone you come into contact with without concern, just because you’ve had a negative test. Social distancing, regular handwashing, good ventilation indoors and wearing a face covering where you can’t socially distance are still the order of the day.

.

Coronavirus Covid-19 Research History – Index

.

Specific Issues Index

from Creating Better World

Posted in coronavirus, Covid-19, pandemic | Tagged , , , , , | Leave a comment

11 things to know about COVID-19 testing

11 things to know about COVID-19 testing

Last updated on June 27, 2021

Whether you’re planning a trip or suspect you may have the novel coronavirus (COVID-19), you may be wondering about testing. But who actually needs coronavirus testing, and what types of tests are most accurate? What actually happens during a COVID-19 nasal swab test? And what does it mean if your test results come back negative?

We spoke with Micah Bhatti, M.D., to learn more.

What actually happens during a COVID-19 nasal swab test? How does COVID-19 testing work?

The person conducting the test will insert a long stick with a very soft brush on the end — kind of like a pipe cleaner — up your nose and twirl it around for a few seconds. The soft bristles will collect a sample of secretions there for analysis. The swab has to go pretty far back, because cells and fluids must be collected from along the entire passageway that connects the base of the nose to the back of the throat to get a really good specimen.

The body is not used to having an object in that area, though, so it creates a lot of very odd sensations. For one thing, it activates the lachrymal reflex, which means it’ll bring tears to your eyes if it’s done correctly. I wouldn’t go so far as to say it hurt, but it is uncomfortable. Since the swab will also touch the back of the throat, it may also trigger a gag reflex.

Are there any other types of COVID-19 tests available?

Yes, tests can be performed on other specimen types that are less invasive, such as a throat swab. But they are less sensitive than the COVID-19 nasal swab test. Saliva is another specimen type that is being explored, but the jury is still out on that one. The preliminary data look really promising. But we’re still waiting on larger studies to confirm these initial findings.

In addition to nucleic acid testing, which detects a virus’ genetic material, there is also antigen testing, which detects the presence of viral proteins that spur the production of antibodies, or the immune system’s response to invaders.

While antigen tests are quicker, they are also much less sensitive than nucleic acid tests. So, while a positive antigen test is informative, a negative result would need to be confirmed by the more sensitive nucleic acid test.

It’s important to obtain the best possible specimens, so COVID-19 nasal swab testing that includes nucleic acid testing, which is what we do for our patients here at MD Anderson, remains the best option. After all, what’s the point of doing a test, if you can’t get an accurate answer? 

What about at-home COVID-19 tests? Are their results reliable?

At-home tests typically involve an individual collecting their own specimen and then shipping it to a testing facility. While the prospect of testing for COVID-19 in the safety and comfort of your own home is quite appealing, the quality and reliability of these at-home test kits is still unknown. 

There are concerns about the quality of specimens people collect on themselves, the integrity of the specimens during shipping, and the expertise of the lab where the testing will be performed. Until those concerns can be addressed, it’s best to have specimens collected by trained medical professionals and testing performed in certified labs that are trusted by your primary care physician.

What should I do if I think I need to be tested for COVID-19?

A COVID-19 nasal swab test must be prescribed by a doctor. So, if you think you might need to be tested for COVID-19, contact your primary care physician or visit a clinic that offers testing.

Is MD Anderson testing its cancer patients for COVID-19?

Our clinical teams may order MD Anderson COVID-19 testing for patients before surgery and some procedures, as well as before certain treatments. COVID-19 vaccination doesn’t eliminate the need for testing in these medical situations. 

Outside test results are helpful to your care team but will not replace MD Anderson COVID-19 testing if your care team determines you need it.

If you’ve been tested for COVID-19 by nasal swab outside of MD Anderson, share a copy of your results with your care team before your appointment. For example, you can attach an image of the results and send it to your care team using MyChart.

Where can I get COVID-19 nasal swab testing if I’m not an MD Anderson patient?

Talk to your family doctor for advice. Many primary care providers offer COVID-19 nasal swab testing, as are many urgent cares, walk-in-clinics and local testing sites. If you live in the Houston area, you can find local testing information by calling 832-393-4220. Be sure to ask if there is a cost for testing and how long it will take to receive the test results.

How accurate is COVID-19 nasal swab testing?

That’s both an easy and a difficult question to answer. The most commonly used test in all clinical laboratories is very sensitive. It’s called a “PCR assay,” which stands for “polymerase chain reaction,” and it is a specific type of nucleic acid test. It looks for traces of the coronavirus’ genetic material, which is what makes a virus do what it does.

In the lab, we can prove a PCR assay can detect very small amounts of the coronavirus. But when we move out into the real world, things get a little more complicated. The two main issues we’ve run into deal with specimen quality and viral load, or how much coronavirus is present in the body.

When you get exposed to COVID-19, it starts replicating in your upper respiratory tract. And the more coronavirus there is, the easier it is to detect. The plateau occurs pretty early on, within a few days of showing symptoms. But if we test you earlier than that, the results aren’t nearly as reliable.

Getting a perfect specimen is a challenge, too, because some collectors don’t feel comfortable inserting the swab as far as they need to go, and patients may jerk back. That’s why we’ve set up swab teams at MD Anderson to improve the quality of the specimens we get. These individuals are highly trained, specifically for the purpose of COVID-19 nasal swab testing.

What happens if my COVID-19 nasal swab test results are negative, but doctors still suspect I have the coronavirus?

First, they would look at your symptoms. Then, they’d consider additional testing, or whether your COVID-19 status could be determined using an alternative method, such as an X-ray.

The coronavirus often starts in the upper respiratory tract — where it causes symptoms like a sore throat, runny nose and dry cough. So, if you’re having those symptoms and they’re being caused by the coronavirus, a COVID-19 nasal swab test should come back positive.

But as it evolves, the coronavirus may move into the lower respiratory tract, where it can cause breathing trouble, a more productive cough and low oxygen levels in your blood. That’s when you might start needing oxygen or a respirator, so your lungs can do their job.

At that point, doctors might order imaging, like a chest X-ray or a CT scan of the lungs, to determine if you have COVID-19. If they see abnormalities that indicate an infectious process, then they’d weigh the risks and benefits of performing a more invasive procedure to obtain samples from inside your lungs.

One of those procedures is a bronchoscopy, where a fiber-optic camera is inserted down the throat and into the lungs to look around and collect samples. That is done only when absolutely necessary, because as with any other medical procedure, there are risks involved.

What are the chances that I might have a false-negative test result?

This is a common question, especially in light of the recent warning from the Food and Drug Administration regarding a high false-negative rate on certain tests.

It’s important to point out that a negative test result may occur in a patient who is in the early stages of the infection and shows no symptoms. A repeat test for this individual may well be positive, as the amount of virus in their body increases to detectable levels. If your physician feels the index of suspicion is high for COVID-19, they may order repeated testing to confirm the initial results. 

What is MD Anderson doing to reduce the chances of getting a false-negative when running COVID-19 nasal swab testing for its patients?

The chances of a false negative at MD Anderson in a symptomatic patient due to a COVID-19 infection are very low, provided the lab receives a good-quality specimen.

MD Anderson takes several measures to ensure a low false-negative rate. First, we use a dedicated team of nurses to collect swabs, which ensures a high-quality specimen is collected every time. Second, the tests used in our laboratory have undergone a verification process to confirm that they perform as expected. And finally, we are tracking when repeat tests are positive on individuals who had previously tested negative.

To date, this last scenario has occurred in less than 1% of our tests. And, in all cases, the time between the negative and positive test results was more than 72 hours, opening up the possibility for infection to have occurred between the two tests’ administration.

I think I had COVID-19 before testing was available. Is there any way to confirm that I had it or that I’m immune to it now?

Not really. You can be tested for antibodies, but the results aren’t going to change how you’ll be treated if you’re a patient, or how you should conduct yourself out in the world.

Antibody tests, also known as serology testing, detect anti-viral proteins in the blood made by your immune system to neutralize the virus. But viruses have lots of different proteins and the antibody response can be very individualized.

Not everybody makes the same antibodies to a virus. So, a negative test result doesn’t necessarily mean you were not exposed to COVID-19. It could just mean the anti-viral proteins the test was set up to look for might not be the same ones your body made.

Similarly, even if I knew you’d had the coronavirus and generated antibodies, we simply don’t know enough to say that they would protect you against reinfection. We just can’t say that with any confidence yet. And as this coronavirus mutates — which all viruses do — antibodies to previous versions might not be effective anymore.

Finally, there’s the possibility that these tests may actually be detecting antibody responses to related or similar viruses. This coronavirus is just one of a much larger family of viruses that circulate regularly among humans. It’s something we’re still striving to unravel, so it makes interpreting antibody test results challenging.

.

Coronavirus Covid-19 Research History – Index

.
Specific Issues Index

from Creating Better World

Posted in coronavirus, Covid-19, pandemic | Tagged , , , , , | Leave a comment

Graphene can be used to detect COVID-19 quickly, accurately

Graphene can be used to detect COVID-19 quickly, accurately

by Jacqueline Carey, University of Illinois at Chicago

‘Wonder material’ can be used to detect COVID-19 quickly, accurately
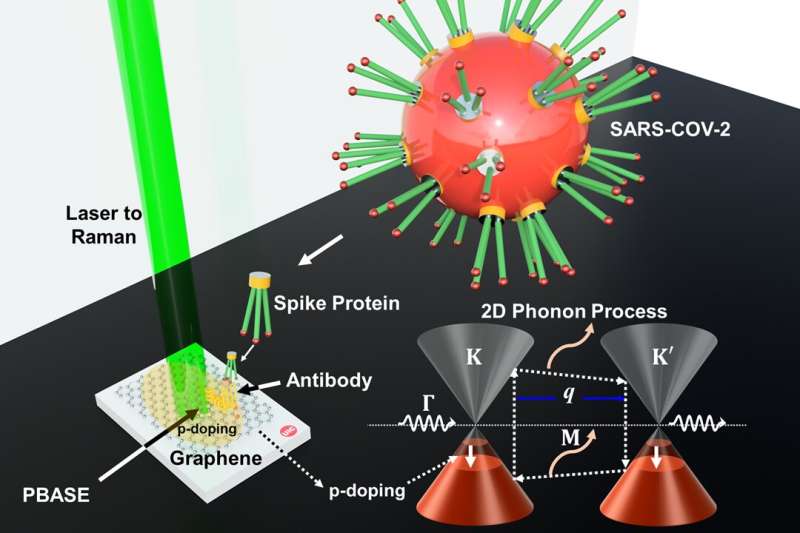
An illustration of the graphene-based COVID-19 spike protein detection process developed at UIC. The white rectangle represents the substrate with graphene functionalized with SARS-CoV-2 antibody (shown in yellow). When this graphene detector interacts with the virus’ spike protein in a COVID-positive sample, its atomic vibration frequency changes. Credit: Vikas Berry

Researchers at the University of Illinois Chicago have successfully used graphene—one of the strongest, thinnest known materials—to detect the SARS-CoV-2 virus in laboratory experiments. The researchers say the discovery could be a breakthrough in coronavirus detection, with potential applications in the fight against COVID-19 and its variants.

In experiments, researchers combined sheets of graphene, which are more than 1,000 times thinner than a postage stamp, with an antibody designed to target the infamous spike protein on the coronavirus. They then measured the atomic-level vibrations of these graphene sheets when exposed to COVID-positive and COVID-negative samples in artificial saliva. These sheets were also tested in the presence of other coronaviruses, like Middle East respiratory syndrome, or MERS-CoV.

The UIC researchers found that the vibrations of the antibody-coupled graphene sheet changed when treated with a COVID-positive sample, but not when treated with a COVID-negative sample or with other coronaviruses. Vibrational changes, measured with a device called a Raman spectrometer, were evident in under five minutes.

Their findings are published today in the journal ACS Nano.

“We have been developing graphene sensors for many years. In the past, we have built detectors for cancer cells and ALS. It is hard to imagine a more pressing application than to help stem the spread of the current pandemic,” said Vikas Berry, professor and head of chemical engineering at the UIC College of Engineering and senior author of the paper. “There is a clear need in society for better ways to quickly and accurately detect COVID and its variants, and this research has the potential to make a real difference. The modified sensor is highly sensitive and selective for COVID, and it is fast and inexpensive.”

“This project has been an amazingly novel response to the need and demand for detection of viruses, quickly and accurately,” said study co-author Garrett Lindemann, a researcher with Carbon Advanced Materials and Products, or CAMP. “The development of this technology as a clinical testing device has many advantages over the currently deployed and used tests.”

Berry says that graphene has unique properties that make it highly versatile, making this type of sensor possible.

Graphene is a single-atom-thick material made up of carbon. Carbon atoms are bound by chemical bonds whose elasticity and movement can produce resonant vibrations, also known as phonons, which can be very accurately measured. When a molecule like a SARS-CoV-2 molecule interacts with graphene, it changes these resonant vibrations in a very specific and quantifiable way.

“Graphene is just one atom thick, so a molecule on its surface is relatively enormous and can produce a specific change in its electronic energy,” Berry said. “In this experiment, we modified graphene with an antibody and, in essence, calibrated it to react only with the SARS-CoV-2 spike protein. Using this method, graphene could similarly be used to detect COVID-19 variants.”

The researchers say the potential applications for a graphene atomic-level sensor—from detecting COVID to ALS to cancer—continue to expand.

.

Coronavirus Covid-19 Research History – Index

.

Specific Issues Index

from Creating Better World

Posted in coronavirus, Covid-19, graphene, Graphene oxide, pandemic | Tagged , , , , , | Leave a comment